
Fig. 2.
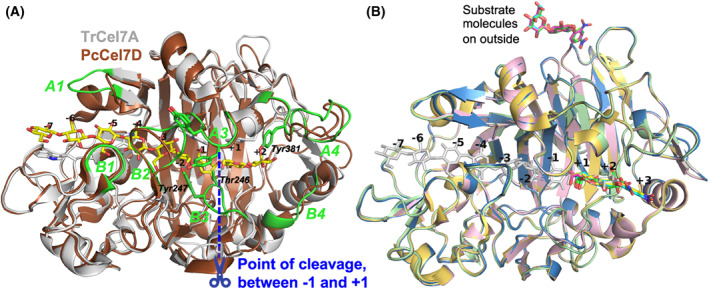
Overview of protein structures and substrate binding. (A) Crystal structure of the catalytic domain of TrCel7A (light‐grey) with cellononaose bound (yellow; PDB: 4C4C) and tunnel‐enclosing loops highlighted and labelled in green, superposed with PcCel7D (brown; PDB: 1Z3V). The point of cleavage at the catalytic center is indicated in blue, from which the glucose unit subsites are numbered, with plus‐signs towards the reducing end and minus‐signs towards the non‐reducing end of the sugar polymer. Sidechains are shown of the sugar‐binding tryptophan platforms at subsites −7, −4, −2 and +1, as well as selected residues involved in substrate binding near the catalytic center. Hydrogen bonds are indicated in cyan between Tyr247 and 6OH at subsite −2 and between Thr246 and 6OH at +1. (B) The four new crystal structures presented here, of TrCel7A showing the binding of the ligands in the product subsites +1 to +3 at the active site, and on the outside of the protein, relative to binding of cellononaose. Ligand/protein colours are as follows: pNPC, yellow/light‐yellow (PDB: 4UWT); pNPL, cyan/light‐blue (PDB: 7OC8); lactose, green/light‐green (PDB: 7NYT); oNPC, magenta/pink (PDB: 4V0Z); Cellononaose, light‐grey (PDB: 4C4C). The structure images were created with macpymol [71].