
Fig. 6.
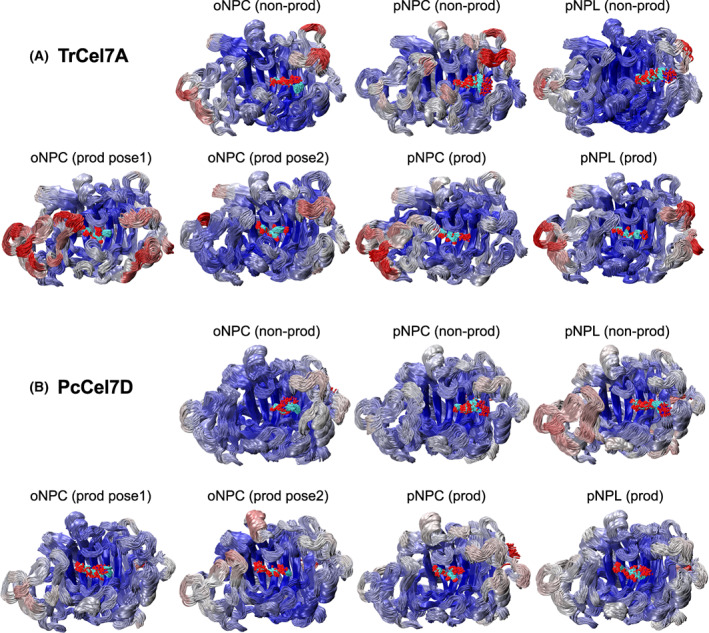
Cluster representations of (A) TrCel7A and (B) PcCel7D protein backbone and ligand structures shown over a 500 ps MD simulation trajectory. The protein backbones are coloured by RMSF (root mean square fluctuation), where red represents the largest fluctuations, and blue represents the lowest fluctuations. The structure images were created with VMD [72].