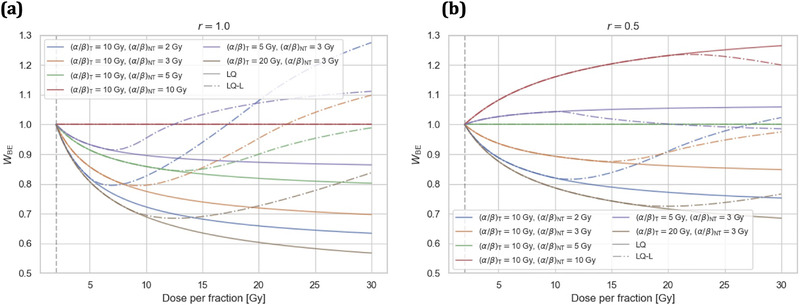
FIGURE 3.

Break‐even normal tissue (NT) sparing factor W BE as predicted by the linear‐quadratic (LQ) and LQ‐linear (LQ‐L) models as a function of dose per fraction d for relative dose levels r of 1.0 (a) and 0.5 (b). Curves for different combinations of (α/β)NT‐ratios (2, 3, 5, and 10 Gy) and (α/β)T‐ratios (5, 10, and 20 Gy) are displayed. A normofractionated treatment with is indicated by a gray dashed vertical line.
