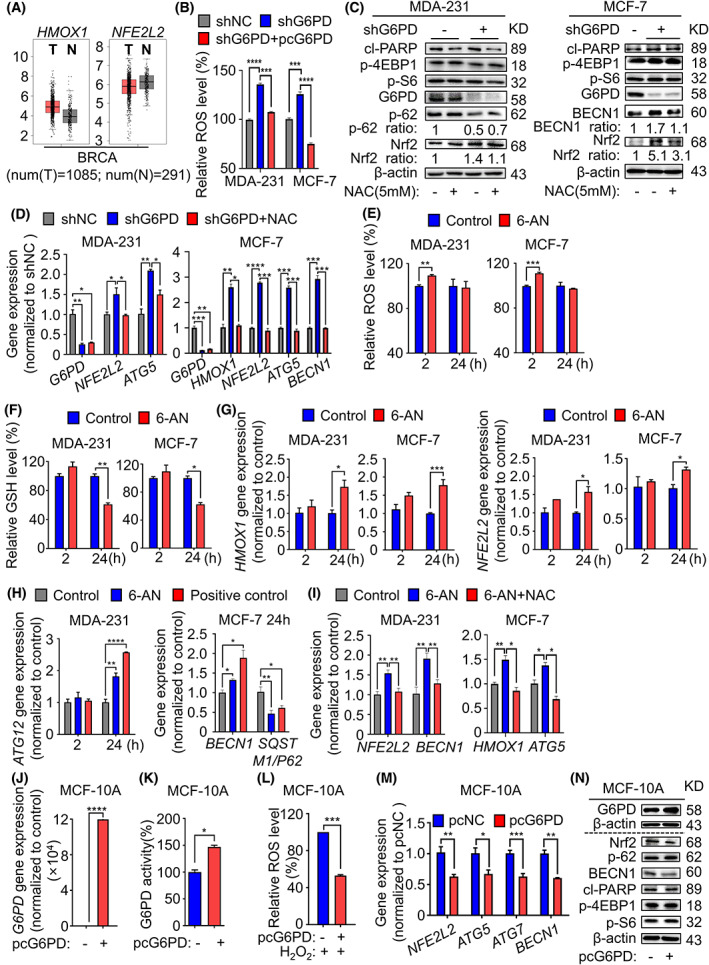
Fig. 5.

Accumulated ROS levels induced autophagy in G6PD‐inhibited breast cancer. (A) Gene expression of HMOX1 and NFE2L2 in normal people (n = 291) and breast cancer patients (n = 1085) was analysed by the StarBase 3.0 website. (B) Cellular ROS levels were measured by flow cytometry assay using DCFH‐DA. (C, D) MDA‐231 and MCF‐7 cells were pretreated with H2O2 for 30 min and then treated with NAC (5 mm) for 2 h. immunoblot analysis of G6PD, cl‐PARP, phospho‐S6, phospho‐4EBP1, phospho‐62, BECN1, and Nrf2 (C). Gene expression of G6PD, NFE2L2, HMOX1, BECN1, and ATG5 were measured using q‐PCR (D). (E–G) MDA‐231 and MCF‐7 cells were treated with 6‐AN. Cellular ROS levels were measured by flow cytometry assay using DCFH‐DA (E). Cellular GSH levels were measured by kit (F). HMOX1 and NFE2L2 were measured using q‐PCR (G). (H) MDA‐231 and MCF‐7 cells were treated with 6‐AN or positive control. Expression of autophagy‐related genes were measured using q‐PCR. (I) MDA‐231 and MCF‐7 cells were treated with 6‐AN or 6‐AN plus NAC (5 mm) for 2 h. NFE2L2, HMOX1, BECN1, and ATG5 were measured using q‐PCR. (E–I) 6‐AN was used with 20 μm for MDA‐231 and 30 μm for MCF‐7. (J–N) MCF‐10A cells were harvested after transfection of G6PD‐overexpressing (pcG6PD) cells for 24 h. Gene expression of G6PD was measured using q‐PCR (J). G6PD enzyme activity was studied using a G6PD enzyme activity detection kit (K). Cellular ROS levels measured by flow cytometry assay using DCFH‐DA, which were treated with H2O2 (100 μm) for 30 min (L). Gene expression of NFE2L2, ATG5, ATG7 and BECN1 was measured using q‐PCR (M). G6PD, cl‐PARP, phospho‐S6, phospho‐4EBP1, phospho‐62, BECN1 and Nrf2 were detected by Western blotting (N). *P < 0.05, **P < 0.01, ***P < 0.001, ****P < 0.0001.
