Fig. 6.

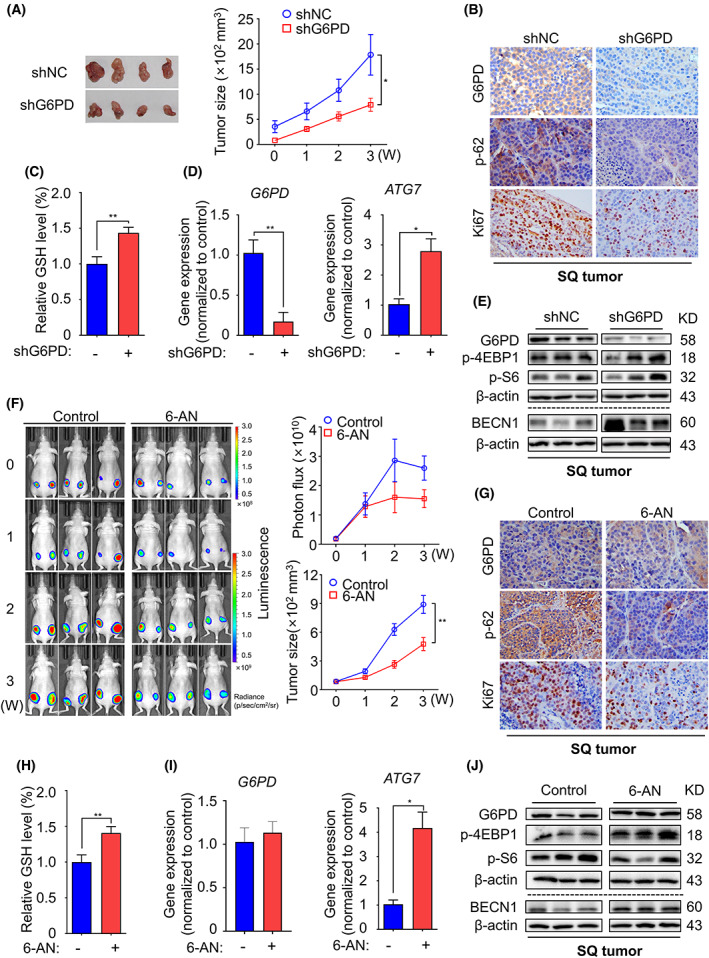
Inhibition of G6PD suppresses tumour growth in preclinical models of breast cancer. (A) Orthotopic xenograft tumour size was measured in female CD1 nude mice with Vernier callipers (n = 5 in each group). (B) Paraffin‐embedded tumour sections derived from MDA‐231 cell‐bearing mice were stained for G6PD, phospho‐62, and Ki67. 400× magnification. (C) Relative GSH levels were measured in xenograft tumour tissues with G6PD knockdown. (D) The gene expression of G6PD and ATG7 in xenograft tumour tissues was detected by q‐PCR. (E) Immunoblot analysis of G6PD, BECN1, phospho‐4EBP1, and phospho‐S6 in xenograft tumours from mice injected with G6PD‐knockdown cells. (F) Tumour‐bearing mice were intraperitoneally administered either vehicle or 6‐AN (5 mg·kg−1, twice a week). Luminescence colour scale: 0 weeks (min = 3 × 10⁷, max = 3 × 10⁸) and 1, 2, and 3 weeks (min = 3 × 10⁸, max = 3 × 10⁹). The statistical graphs in the right panel indicate the photon flux of the tumour. Subcutaneous tumour size statistics after 20 days of mouse administration (n = 5 in each group). (G) IHC staining tests G6PD, phospho‐62, and Ki67 in orthotopic tumours derived from MDA‐231 cells treated with 6‐AN. 400× magnification. (H) Relative GSH levels were measured in xenograft tumour tissues treated with 6‐AN. (I) The gene expression of G6PD and ATG7 in xenograft tumour tissues was detected by q‐PCR. (J) Immunoblot analysis of G6PD, BECN1, phospho‐4EBP1, and phospho‐S6 in xenograft tumours from mice treated with 6‐AN. *P < 0.05, **P < 0.01.
