Figure 1.

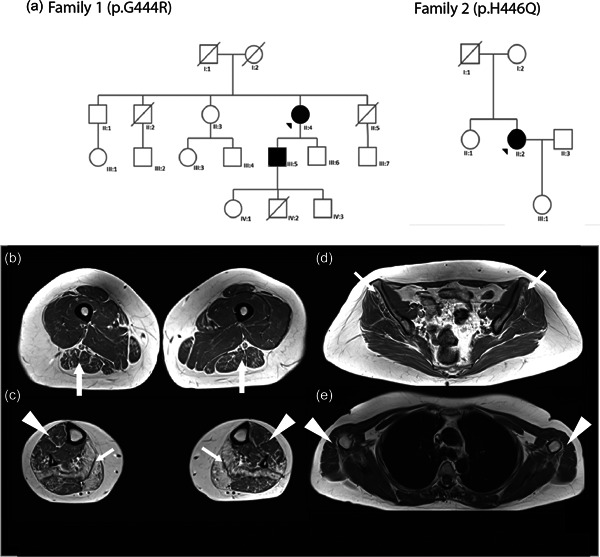
Pedigree of the two families. (a) Pedigree of families 1 and 2. Black arrows represent proband. (b–e). Axial T1‐weighted lower limbs muscle MRI scans from Patient F2: II2. Fatty infiltration was graded using Mercuri score (Mercuri et al., 2002) graded from 0 (normal appearance) to 4 (total fatty replacement of the muscle). (b) Legs: Atrophy and fat replacement (Mercuri Grade 4) prominently in solei and gastrocnemii medialis (arrows). Mild fatty infiltration in the tibialis anterior and peroneus lateralis (arrowheads), and gastrocnemius lateralis (Grade 2). (c) Thigh: Asymmetrical atrophy of the thigh more pronounced on the right side. Mild fatty infiltration observed in biceps femoris (arrows), semitendinosus, semimembranosus, and sartorius muscles. (Grade 2). (d) Pelvis girdle: Moderate the fatty degeneration of the gluteus minimus (arrows) and gluteus medius (Grades 2 and 1, respectively, for the right and left side). (e) Scapular girdle: Note the mild fatty infiltration of the deltoids (arrowheads). MRI, magnetic resonance imaging
