
Figure 3.
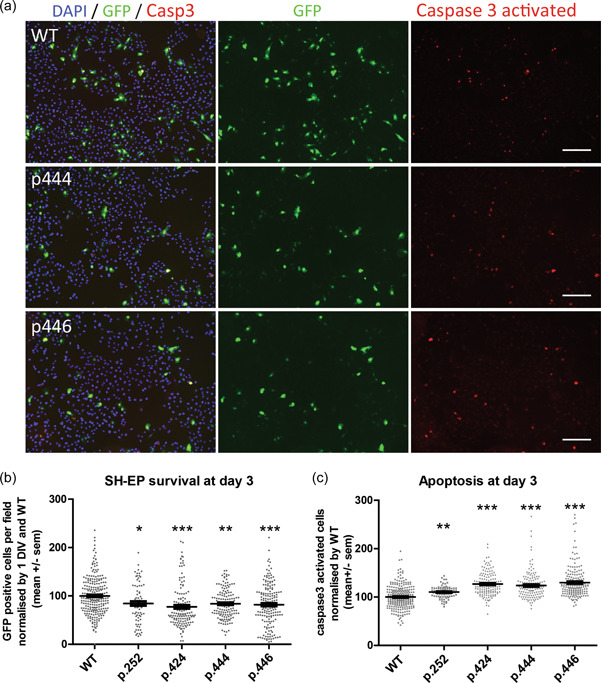
MORC2 mutants affect SH‐EP survival and apoptosis. (a) Microscope images of SH‐EP culture at 3 days in vitro after MORC2 transfection. Cell are counted stained for nuclei with DAPI (in blue). Apoptotic cells are stained with anti activated‐caspase 3 antibody (in red). Scale 100 µm. (b) SH‐EP survival quantification by counting eGFP positive cells in more than 75 fields from more than 3 independent experiments. Kruskal–Wallis test followed by Dunn's multiple comparison test. (c) Quantification of the percentage of activated‐caspase 3 positive cell at Day 3 and normalized by WT condition. Kruskal–Wallis test followed by Dunn's multiple comparison test. ns p < 0.05; *p < 0.01; **p < 0.001; ***p< 0.0001. p252 is p.Arg252Trp; p424 is p.Thr424Arg; p444 is p.Gly444Arg; p446 is p.His446Gln.