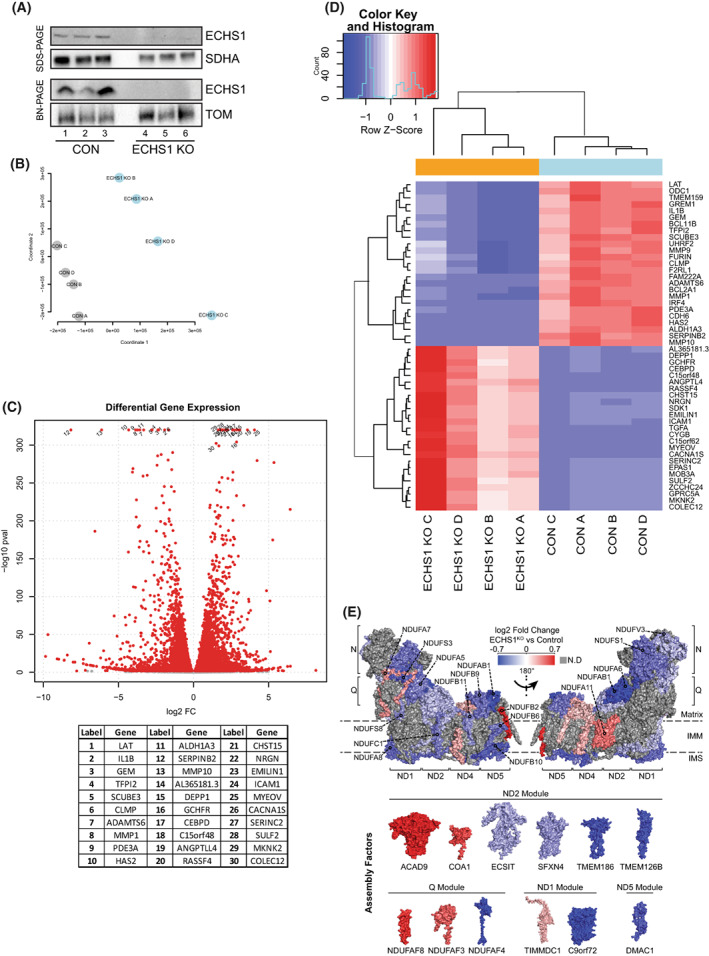
Fig. 1.

Knockout of ECHS1 impacts global gene expression. (A) Western blot analysis of ECHS1 KO cells confirming the absence of ECHS1 protein via both SDS/PAGE and BN‐PAGE. Image shown is representative of three independent experiments. (B) Multidimensional scaling analysis shows sample clustering based on sample type, either ECHS1 KO cells or control (CON) cells. (C) Volcano plot depicting gene expression changes in ECHS1 KO cells. In total, 11 278 genes were differentially expressed, with 5359 upregulated and 5919 downregulated. Red points indicate False discovery rate; false positive to total positive rate; FDR < 0.05. Top 30 genes with differential expression (as determined by P value) labelled. (D) Heatmap of the 50 most significantly differentially expressed genes in ECHS1 KO cells. (E) Topographical heatmap showing RNA‐Seq log2 fold‐changes mapped onto the structure of complex I, and its assembly factors, from ESCH1 KO cells. Complex I assembly factors are grouped according to their associated complex I assembly modules. Grey subunits had no significant differences in expression.
