Fig. 3.

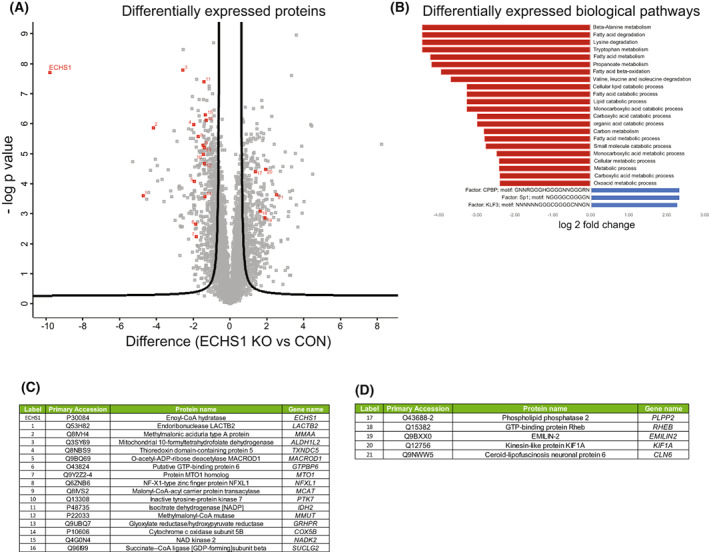
Biological pathways impacted by the loss of ECHS1 protein. (A) Volcano plot of 274 differentially expressed proteins from isolated ECHS1 KO mitochondria; 142 are upregulated and 132 are downregulated compared to control. ECHS1 is shown in red in the top left quadrant. Permutation‐based FDR set at < 1% and s0 = 1. ECHS1 was present in control (CON) cells but at negligible levels in ECHS1 KO cells. Significantly altered proteins which also had significantly altered transcript levels are numbered in red. (B) Functional enrichment of mitochondrial proteins using GO terms and KEGG pathways. Shown are top tier terms with Fisher's exact test and Bonferroni post hoc testing with P < 0.05. (C) Significantly decreased proteins in ECHS1 KO mitochondria that also had significantly reduced transcript levels detected by RNA‐seq (proteins 1–16 in Volcano plot, ranked by protein log2 fold change). (D) Significantly increased proteins in ECHS1 KO mitochondria that also had increased transcript levels detected by RNA‐seq (proteins 17–21 in Volcano plot, ranked by protein log2 fold change).
