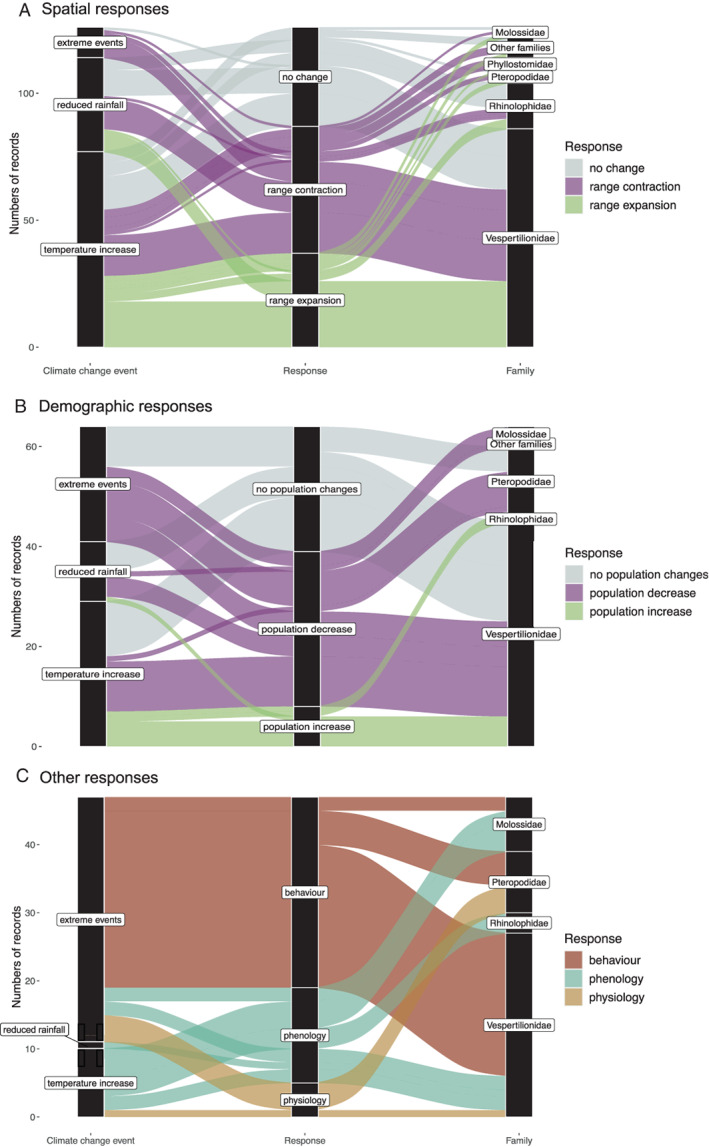
Fig. 4.

Effects of climate change on bats, weighted according to the number of records, for (A) spatial responses, (B) demographic responses, and (C) other responses (behaviour, physiology and phenology). Plots show bat family, reported climate change events, and bat response. In (A) and (B), responses are classified as either positive (range expansion or population increase, in green), negative (range contraction or population decrease, in pink) or neutral (no change, in grey). In (C), climate change events are related to three specific types of response (behaviour, physiology, phenology) due to the more variable nature of these responses and the low number of studies for each category. Note that only responses with N > 5 are included in this figure.
