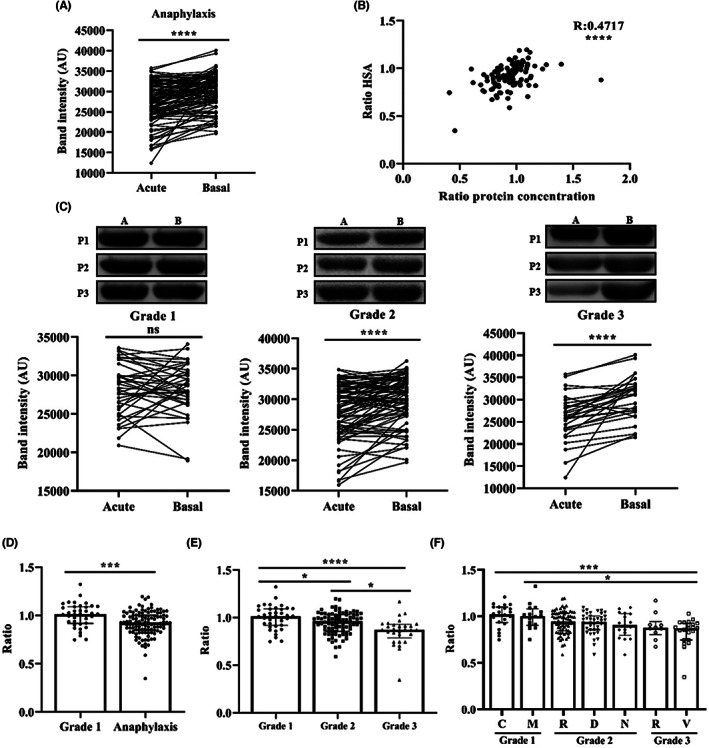
FIGURE 3.

Human serum albumin (HSA) levels decreased with the severity of anaphylaxis. (A) HSA levels during the acute phase and at baseline in patients with anaphylaxis (****p < .0001). AU, arbitrary units. (B) Correlation between HSA values and serum protein concentration (****p < .0001). (C) The images above show a representative Western blot of HSA in the acute phase (A) and at baseline (B) of three patients (P1, P2 and P3) with Grade 1, Grade 2 and Grade 3 reactions. Quantification of HSA levels in the acute phase and at baseline of Grade 1, Grade 2 (****p < .0001) and Grade 3 (****p < .0001) reactions. (D) Acute/basal ratio of HSA in Grade 1 and anaphylactic reactions (***p = .0005). (E) Stratification of HSA ratio values according to severity classification. Grade 1 vs. Grade 2 (*p = .0416); Grade 1 vs. Grade 3 (****p < .0001); Grade 2 vs. Grade 3 (*p = .0106). (F) Acute/basal ratio of HSA in Grade 1, Grade 2 and Grade 3 reactions based on the affected organs/systems. Grade 1C vs. Grade 3V (***p = .0003); Grade 1M vs. Grade 3V (*p = .0110). Grade 1C (n = 22), Grade 1M (n = 16), Grade 2R (n = 72), Grade 2D (n = 40), Grade 2N (n = 17), Grade 3R (n = 10), Grade 3V (n = 22). C, cutaneous; D, digestive; M, mucosal; N, neurological; ns, not statistically significant; R, respiratory; V, vascular.
