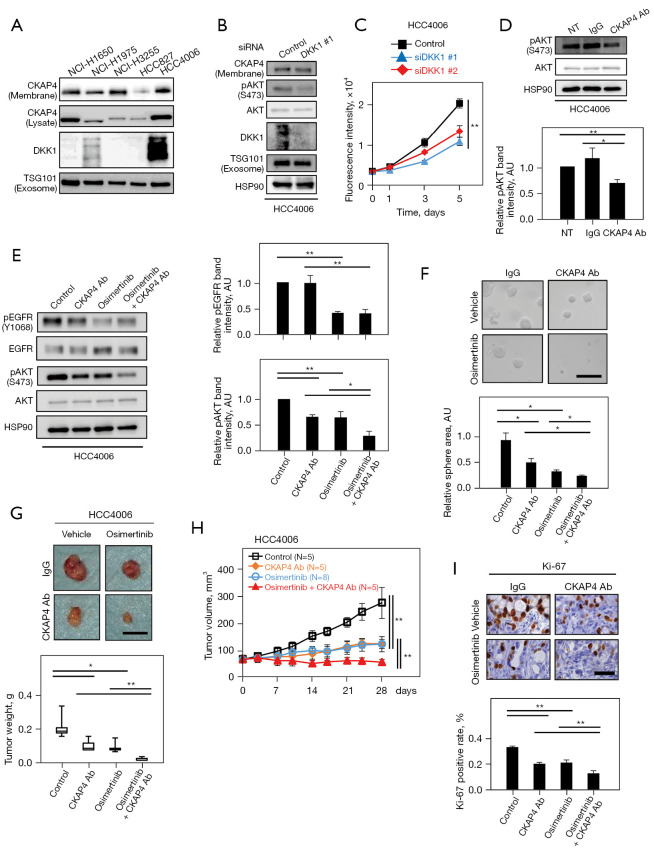
Figure 5.
The anti-CKAP4 antibody strongly inhibits tumor growth in EGFR mutant positive NSCLC cells when combined with osimertinib. (A) Lysates, and precipitated PM proteins of indicated NSCLC cells harboring EGFR mutations were probed with indicated antibodies. (B) SEVs were prepared from the CM of HCC4006 cells transfected with control (scramble) or DKK1 siRNA. (C) HCC4006 cells transfected with control or DKK1 siRNAs were subjected to 2D cell proliferation assays using CyQUANT NF. (D) Top panels: HCC4006 cells were treated with 20 µg/mL anti-CKAP4 or control IgG antibodies for 6 h. Bottom panel: pAKT band intensities were normalized to total AKT levels and quantified. (E) Left panels: HCC4006 cells were treated for 6 h with 20 µg/mL control IgG, 20 µg/mL anti-CKAP4 antibody, 3 nmol/L osimertinib, or 20 µg/mL anti-CKAP4 antibody and 3 nmol/L osimertinib. Right panels: pAKT band intensities and pEGFR (normalized by total AKT and total EGFR, respectively) were quantified. (F) Top panels: HCC4006 cells were treated with 20 µg/mL control IgG, 20 µg/mL anti-CKAP4 antibody, 3 nmol/L osimertinib, or 20 µg/mL anti-CKAP4 antibody and 3 nmol/L osimertinib and cultured for 5 days in 3D Matrigel, and were observed with a phase contrast microscope. Bottom panels: total areas of spheres/field (n=5 fields) were quantified. (G) Top panels: HCC4006 cells were subcutaneously implanted into immunodeficient mice. When tumor volumes reached 50 mm3, mice were randomly assigned to the following four therapeutic conditions for 4 weeks (N≥5/condition); control (control IgG and vehicle), CKAP4 Ab (anti-CKAP4 antibody and vehicle), osimertinib (control IgG and osimertinib), and osimertinib + CKAP4 Ab (anti-CKAP4 antibody and osimertinib) [anti-CKAP4 antibody or control IgG (200 µg/body, intraperitoneally injected twice a week), and osimertinib or vehicle (1.25 mg/kg oral administration, daily)]. Representative appearance of extirpated xenograft tumors is shown. Bottom panels, the weights of the extirpated xenograft tumors were measured. Results are indicated by a box plot. The median is represented with a line, the box represents the 25th–75th percentile, and error bars show the 5th–95th percentile. (H) Xenograft tumor volumes in (G) were measured at indicated times. (I) Top panels: sections from xenograft tumors in (G) were stained with hematoxylin and an anti-Ki-67 antibody. Bottom panel: the percentages of Ki-67-positive cells are expressed (n=5 fields). Results are shown as the mean ± SD (C-F,H,I) of three independent experiments (D and E). *, P<0.05; **, P<0.01 (Student’s t-test) (C, F and I); *, P<0.05; **, P<0.01 (Wilcoxon’s rank-sum test) (D, E, G, and H). Scale bars, 100 µm (F); 10 mm (G); 50 µm (I). AKT, Ak strain transforming; NT, no treatment; AU, arbitrary unit; EGFR, epidermal growth factor receptor; Ab, antibody; NSCLC, non-small cell lung cancer; PM, plasma membrane; SEVs, small extracellular vesicles; CM, conditioned medium; SD, standard deviation.

