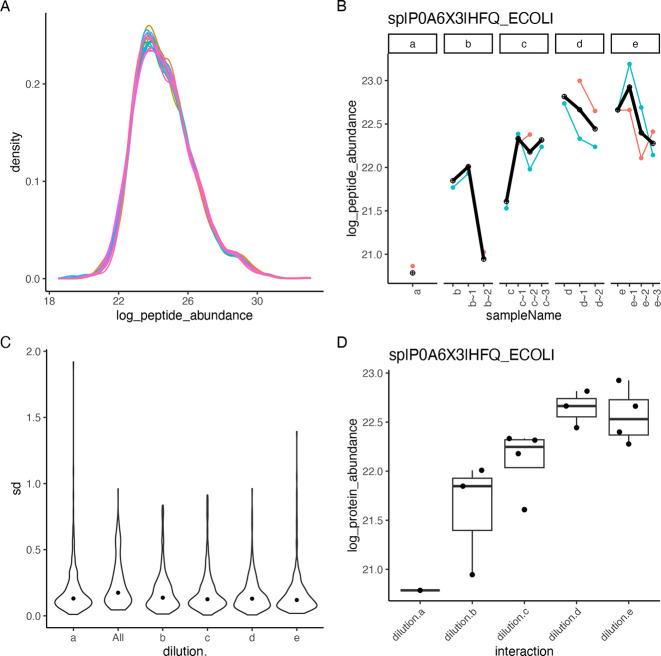
Figure 3.
(A) Density plot of peptide intensity distributions for 20 samples. For each sample a line with a different color is shown. (B) Peptide intensities for protein HFQ_ECOLI are shown using lines of different colors, and the protein intensity estimate is shown using a fat black line. (C) Distribution of standard deviations of all proteins in each dilution group (a–e) and overall (all). (D) Distribution of protein intensities of Protein HFQ_ECOLI in each dilution group.

