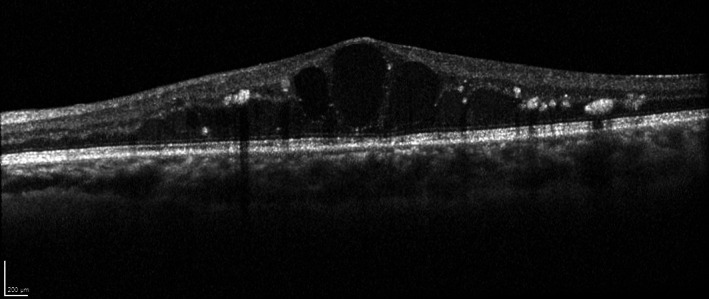
FIGURE 5.

Spectral‐domain optical coherence tomography (SD‐OCT) B‐scan of a left eye with centre‐involved diabetic macular oedema (CI‐DMO). Intraretinal cystoid spaces, intraretinal fluid and hyperreflective foci are observed and the central subfield thickness was measured to be 560 μm. Image was obtained with the HRA + OCT (Heidelberg Engineering, Heidelberg, Germany)
