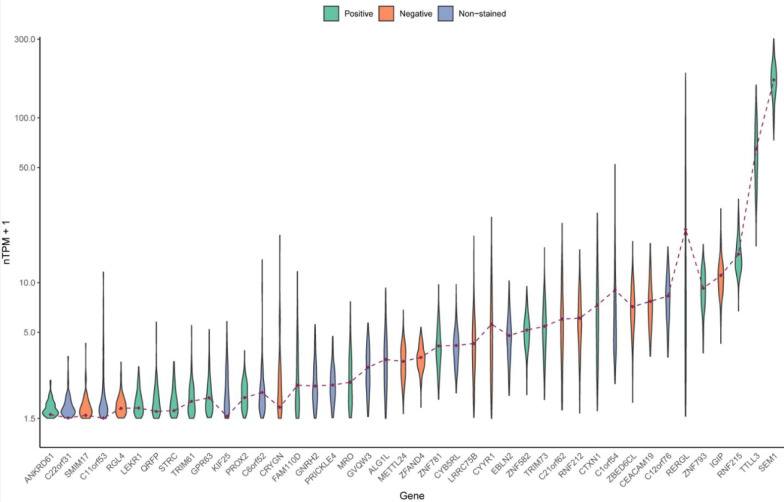
Figure 2.
Violin plots displaying the expression level (nTPM+1) of the 42 candidates among the ovarian GTEx samples. The brown dots represent the consensus value from GTEx and were used as threshold values. The ones excluded for the IHC analysis (n = 12) are in blue, those with a negative or indistinct staining in the initial test staining (n = 12) are in orange, and those with a distinct positive staining in the ovary (n = 18) in green.

