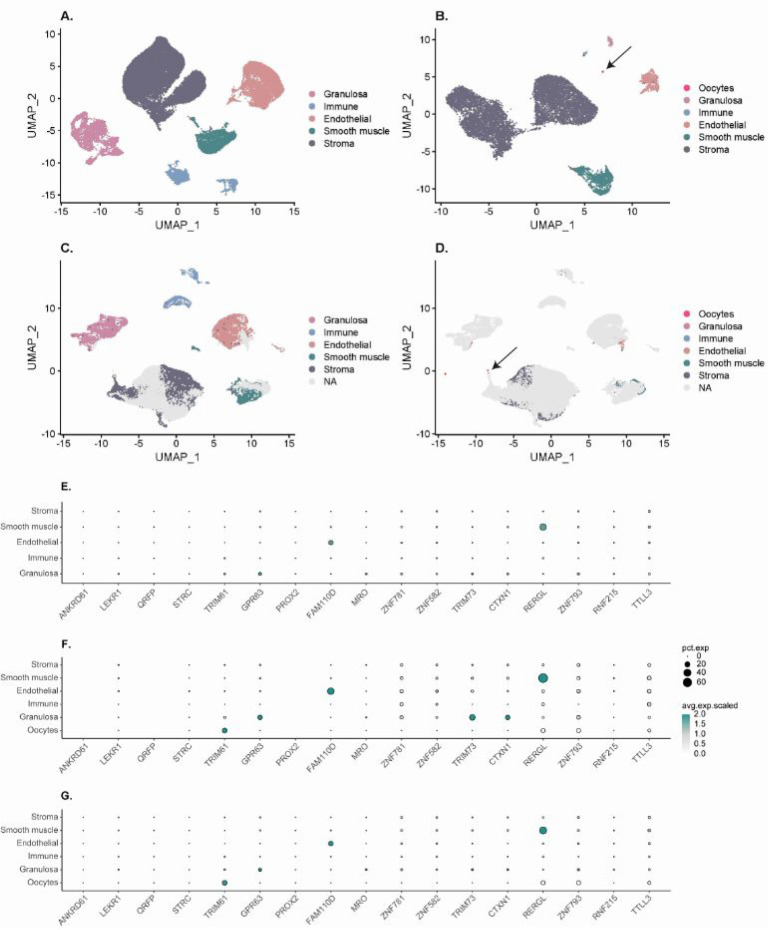
Figure 4.
Overview of the scRNAseq analysis. UMAP plots of the GSE118127 data set (A), the E-MTAb-8381 data set (B), and the integration of the two data sets with colored cells from the GSE118127 data set (C) or the E-MTAb-8381 data set (D) in order to highlight the contribution of each data set in the integrated one. Dotplots displaying the scaled expression levels of the 18 top candidates from the GSE118127 data set (E), the E-MTAb-83831 data set (F), and the integrated one (G). The size of the dots represent the percentage of cells expressing the marker in each cluster (pct.exp), and the color scale represents the average expression level. ANKRD61, PROX2, and QRFP expression values were not available in the E-MTAb-83831 data set (F), and SEM1 expression values were not available in any of the two data sets and are not displayed at all in the dotplots.

