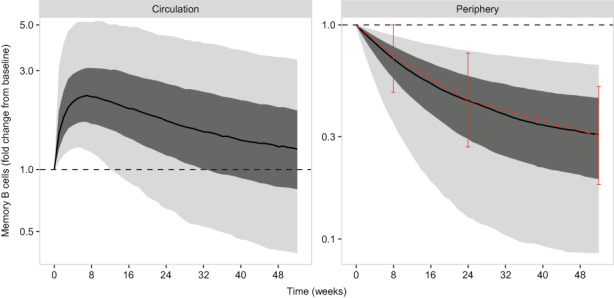
FIGURE 4.

Simulation (Model D, final model) for 10 mg/kg i.v. dosing every 4 weeks. E max, maximum response of the model stimulatory function. Median (black line), interquartile range (dark gray region) and 90% prediction interval (light gray region) are shown. The median memory B‐cell level at baseline is shown as the horizontal black dotted line. The naive B‐cell fold change from baseline is superimposed on the peripheral memory B‐cell levels (that is, the unobserved memory B cells outside of circulation), as the median (red points) and interquartile range (solid vertical bars).
