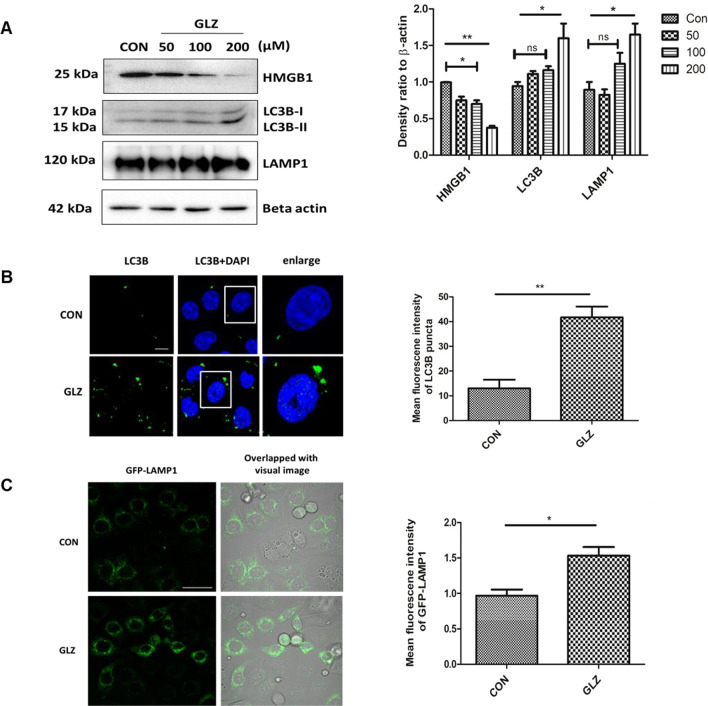
Fig. 1.
Glycyrrhizin treatment overexpresses autophagy proteins. AGS cells were treated with glycyrrhizin GLZ (200 µM) or DMSO for 4 h a Cell lysates were prepared and expression level of HMGB1 and autophagy marker proteins LC3B-II and LAMP1 was observed by western blot analysis. Beta-actin was used as a protein loading control. Densitometry analyses are represented graphically. b Control and drug-treated cells were subjected to immunofluorescence and changes in the mean fluorescence intensity were measured. Scale bar: 5 μm. Confocal microscopy showed LC3B puncta (green) formation. LC3B puncta formation was quantified and graphically plotted. c Live cell imaging was performed using a construct, LAMP1-GFP for labeling lysosomes under confocal microscopy. Fold change in the mean fluorescence intensity of GFP-LAMP1 was calculated. Scale bar: 10 μm. Graphs were represented as mean ± SEM (n = 3); Unpaired t-test was done and significance was calculated; *p < 0.05 and **p < 0.01

