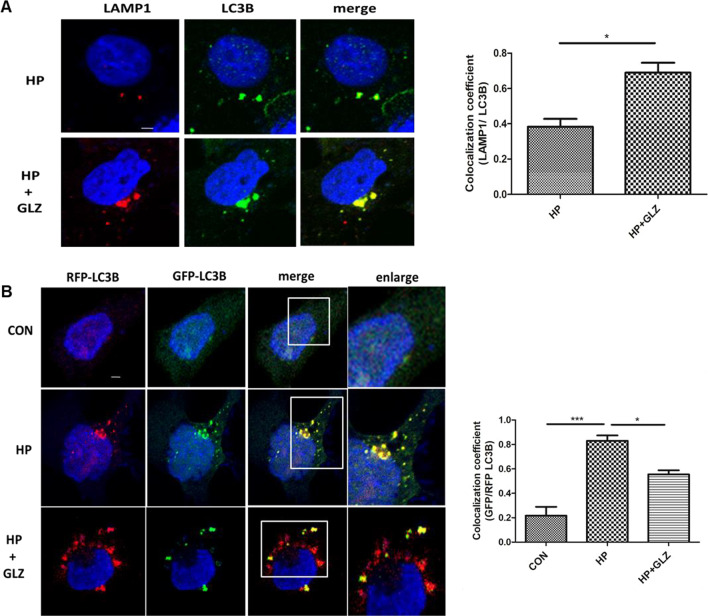
Fig. 3.
Activation of autophagic flux by glycyrrhizin treatment (a, b) Cells were incubated with H. pylori SS1 strain (4 h) followed by glycyrrhizin GLZ (200 µM) exposure for 4 h. a Glycyrrhizin (GLZ) exposure to H. pylori-infected cells for 4 h was subjected to LAMP1 and LC3B double immunofluorescence. Confocal microscopy showed yellow puncta with co-localization of LC3B puncta (green) & LAMP1 (red). Change in the co-localization coefficient of each group was calculated. Scale bar: 2 μm. b AGS cells were transfected with a tandem mRFP-GFP tag (tfLC3B) plasmid & further infected with H. pylori SS1 strain (MOI 100) for 4 h and finally, glycyrrhizin (GLZ) (200 µM) treatment was done for 4 h. Confocal microscopy showed LC3B puncta formation in control (CON), H. pylori (HP) infected & H. pylori + glycyrrhizin (HP + GLZ) treated cells. The yellow puncta showed autophagosomes. The free red puncta are autolysosomes. Change in the co-localization coefficient of each group was calculated. Scale bar: 2 μm. Graph represented as mean ± SEM (n = 3); Significance was determined by Unpaired t-test; *p < 0.05, ***p < 0.001

