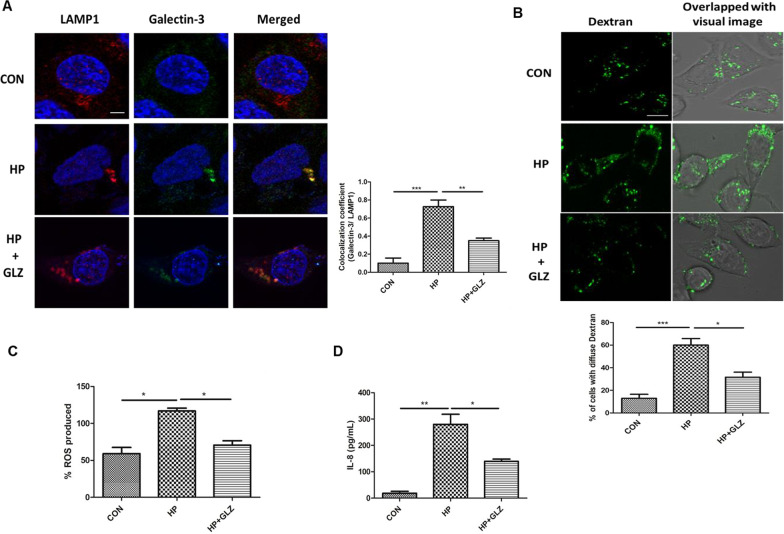
Fig. 6.
Lysosomal membrane integrity is restored by glycyrrhizin. a–d Infection with H. pylori SS1 strain (MOI 100) was performed for 4 h followed by glycyrrhizin (GLZ) (200 µM) treatment (4 h). a Double immunofluorescence was done with LAMP1 & Galectin-3 antibodies to confirm LMP. Cells were observed under the confocal microscope and the difference in the co-localization coefficient of each group was calculated. Scale bar: 2 μm. b Lysosomal destabilization was estimated using live cell imaging after staining with dextran (0.5 mg/ml) for 2 h under the confocal microscope and the number of cells with diffused dextran was counted Scale bar: 5 μm. c Expression of reactive oxygen species (ROS) in infected and drug-treated cells was determined by DCFDA methods for 30 min in a fluorimeter. d The expression of IL-8 from media collected after treatment was analyzed by ELISA in a microplate reader. Graphs were generated using GraphPad Prism 5 and represented as mean ± SEM (n = 3); Significance was calculated by one-way ANOVA; *p < 0.05, **p < 0.01, ***p < 0.001

