
Figure 4.
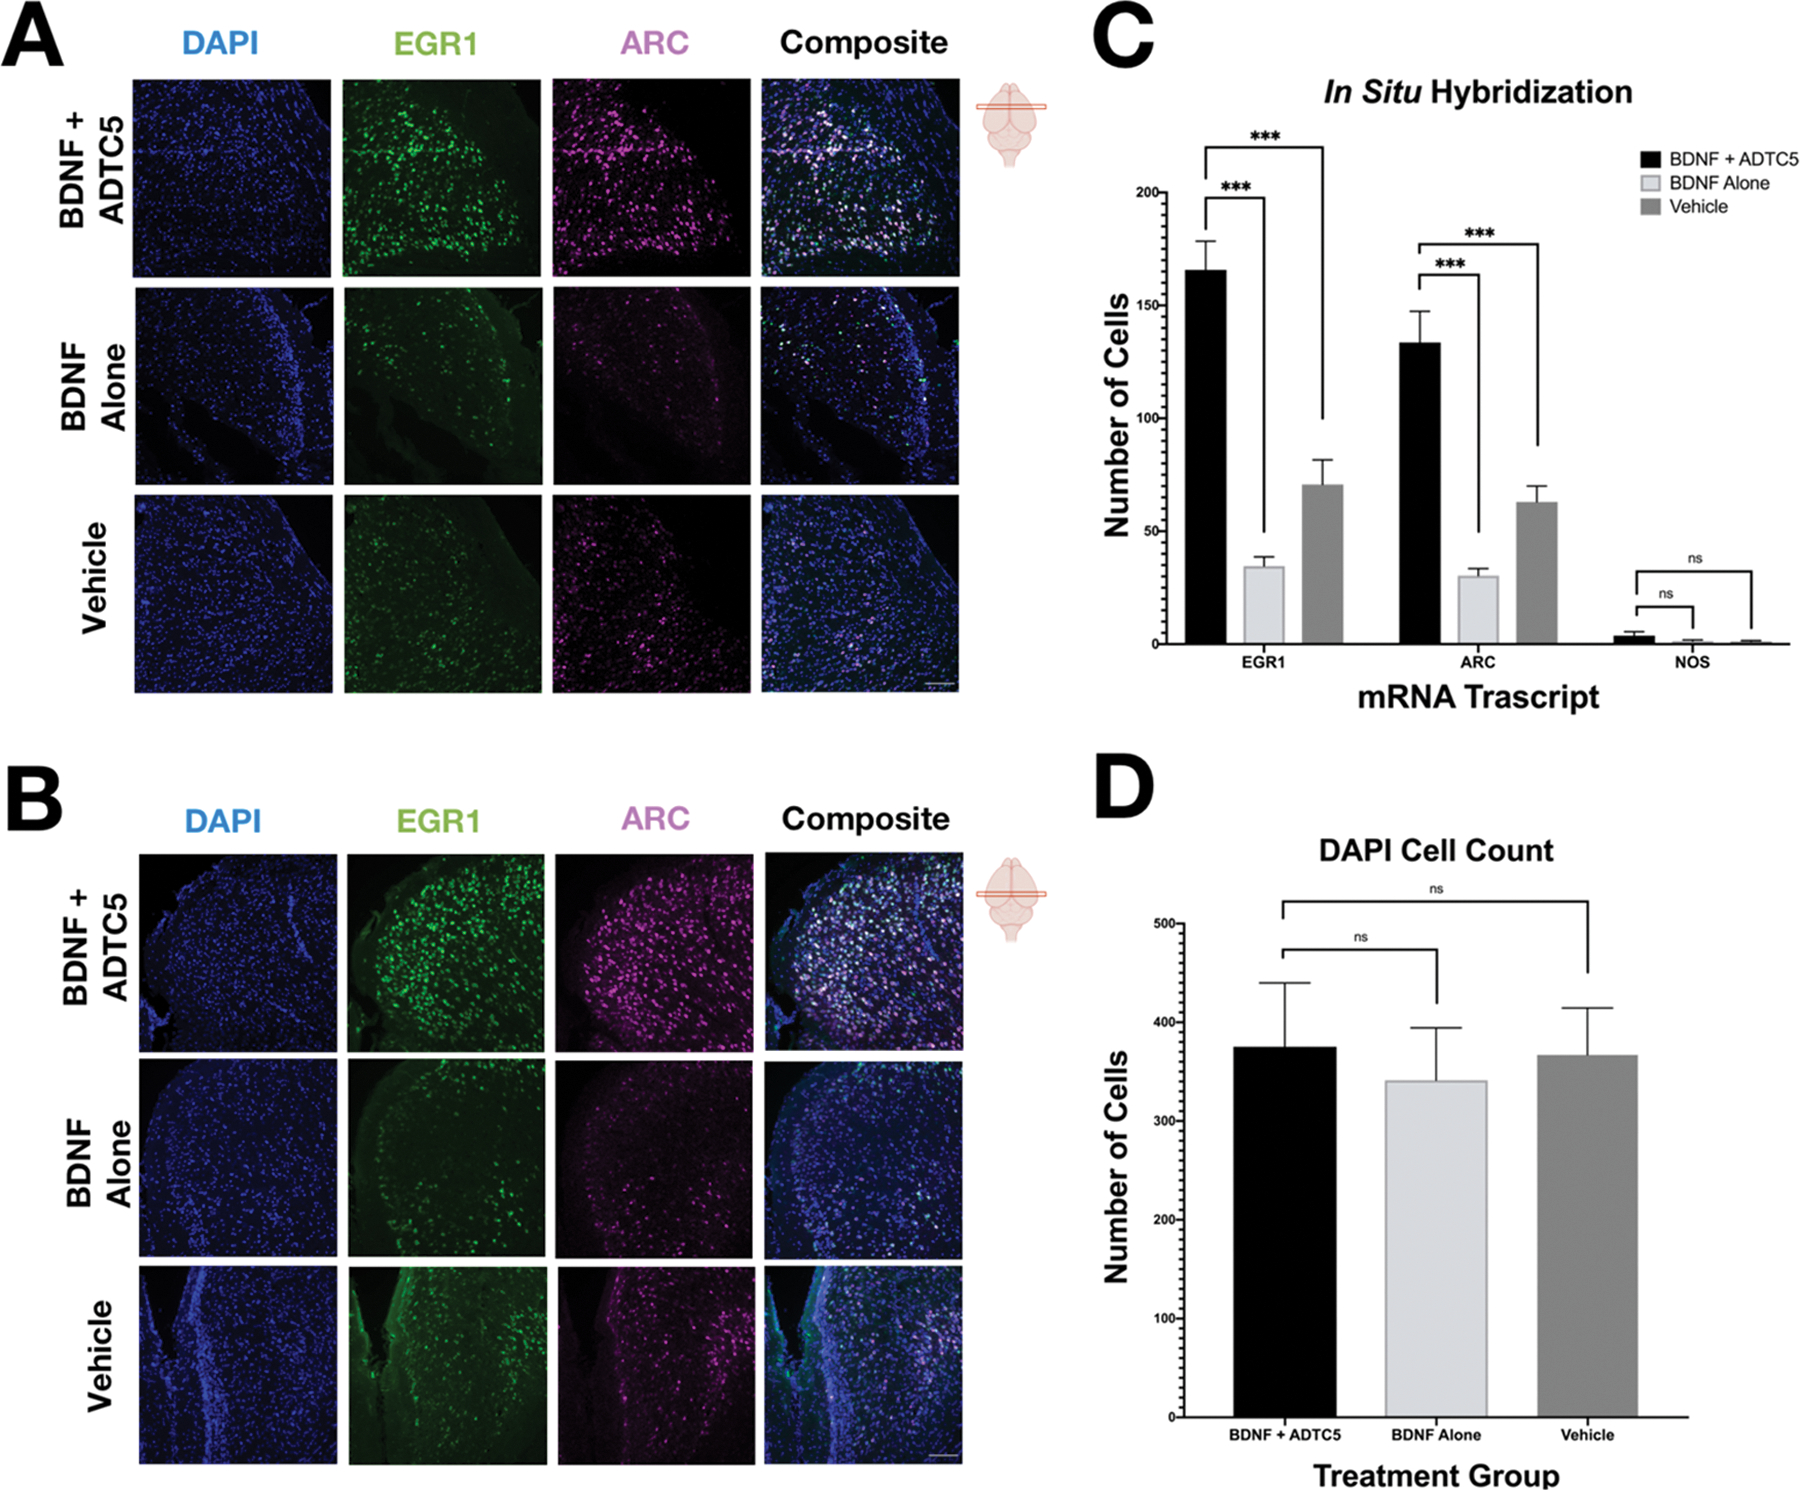
Effects of BDNF (5.71 nmol/kg) + ADTC5 (10 μmol/kg), BDNF alone (5.71 nmol/kg), or vehicle treatments on mRNA expression of EGR1 and ARC in the cortex of the brains of SJL/elite EAE mice. (A, B) Photomicrograph of DAPI (blue), EGR1 (green), ARC (magenta), and composite images taken of the cortex of the midbrain (A) and hindbrain (B) of EAE mice treated with BDNF + ADTC5, BDNF alone, or vehicle. (C) Quantitative comparison of EGR, ARC, and NOS1 mRNA transcript expression, as determined by cell count, for mice treated with BDNF + ADTC5, BDNF alone, or vehicle. (D) Quantitative comparison of DAPI cell count; scale bar = 50 μm; ***p ≤ 0.001; one-way ANOVA (99% confidence; n = 5). Contrast and brightness of images were adjusted only for display purposes.