
Figure 5.
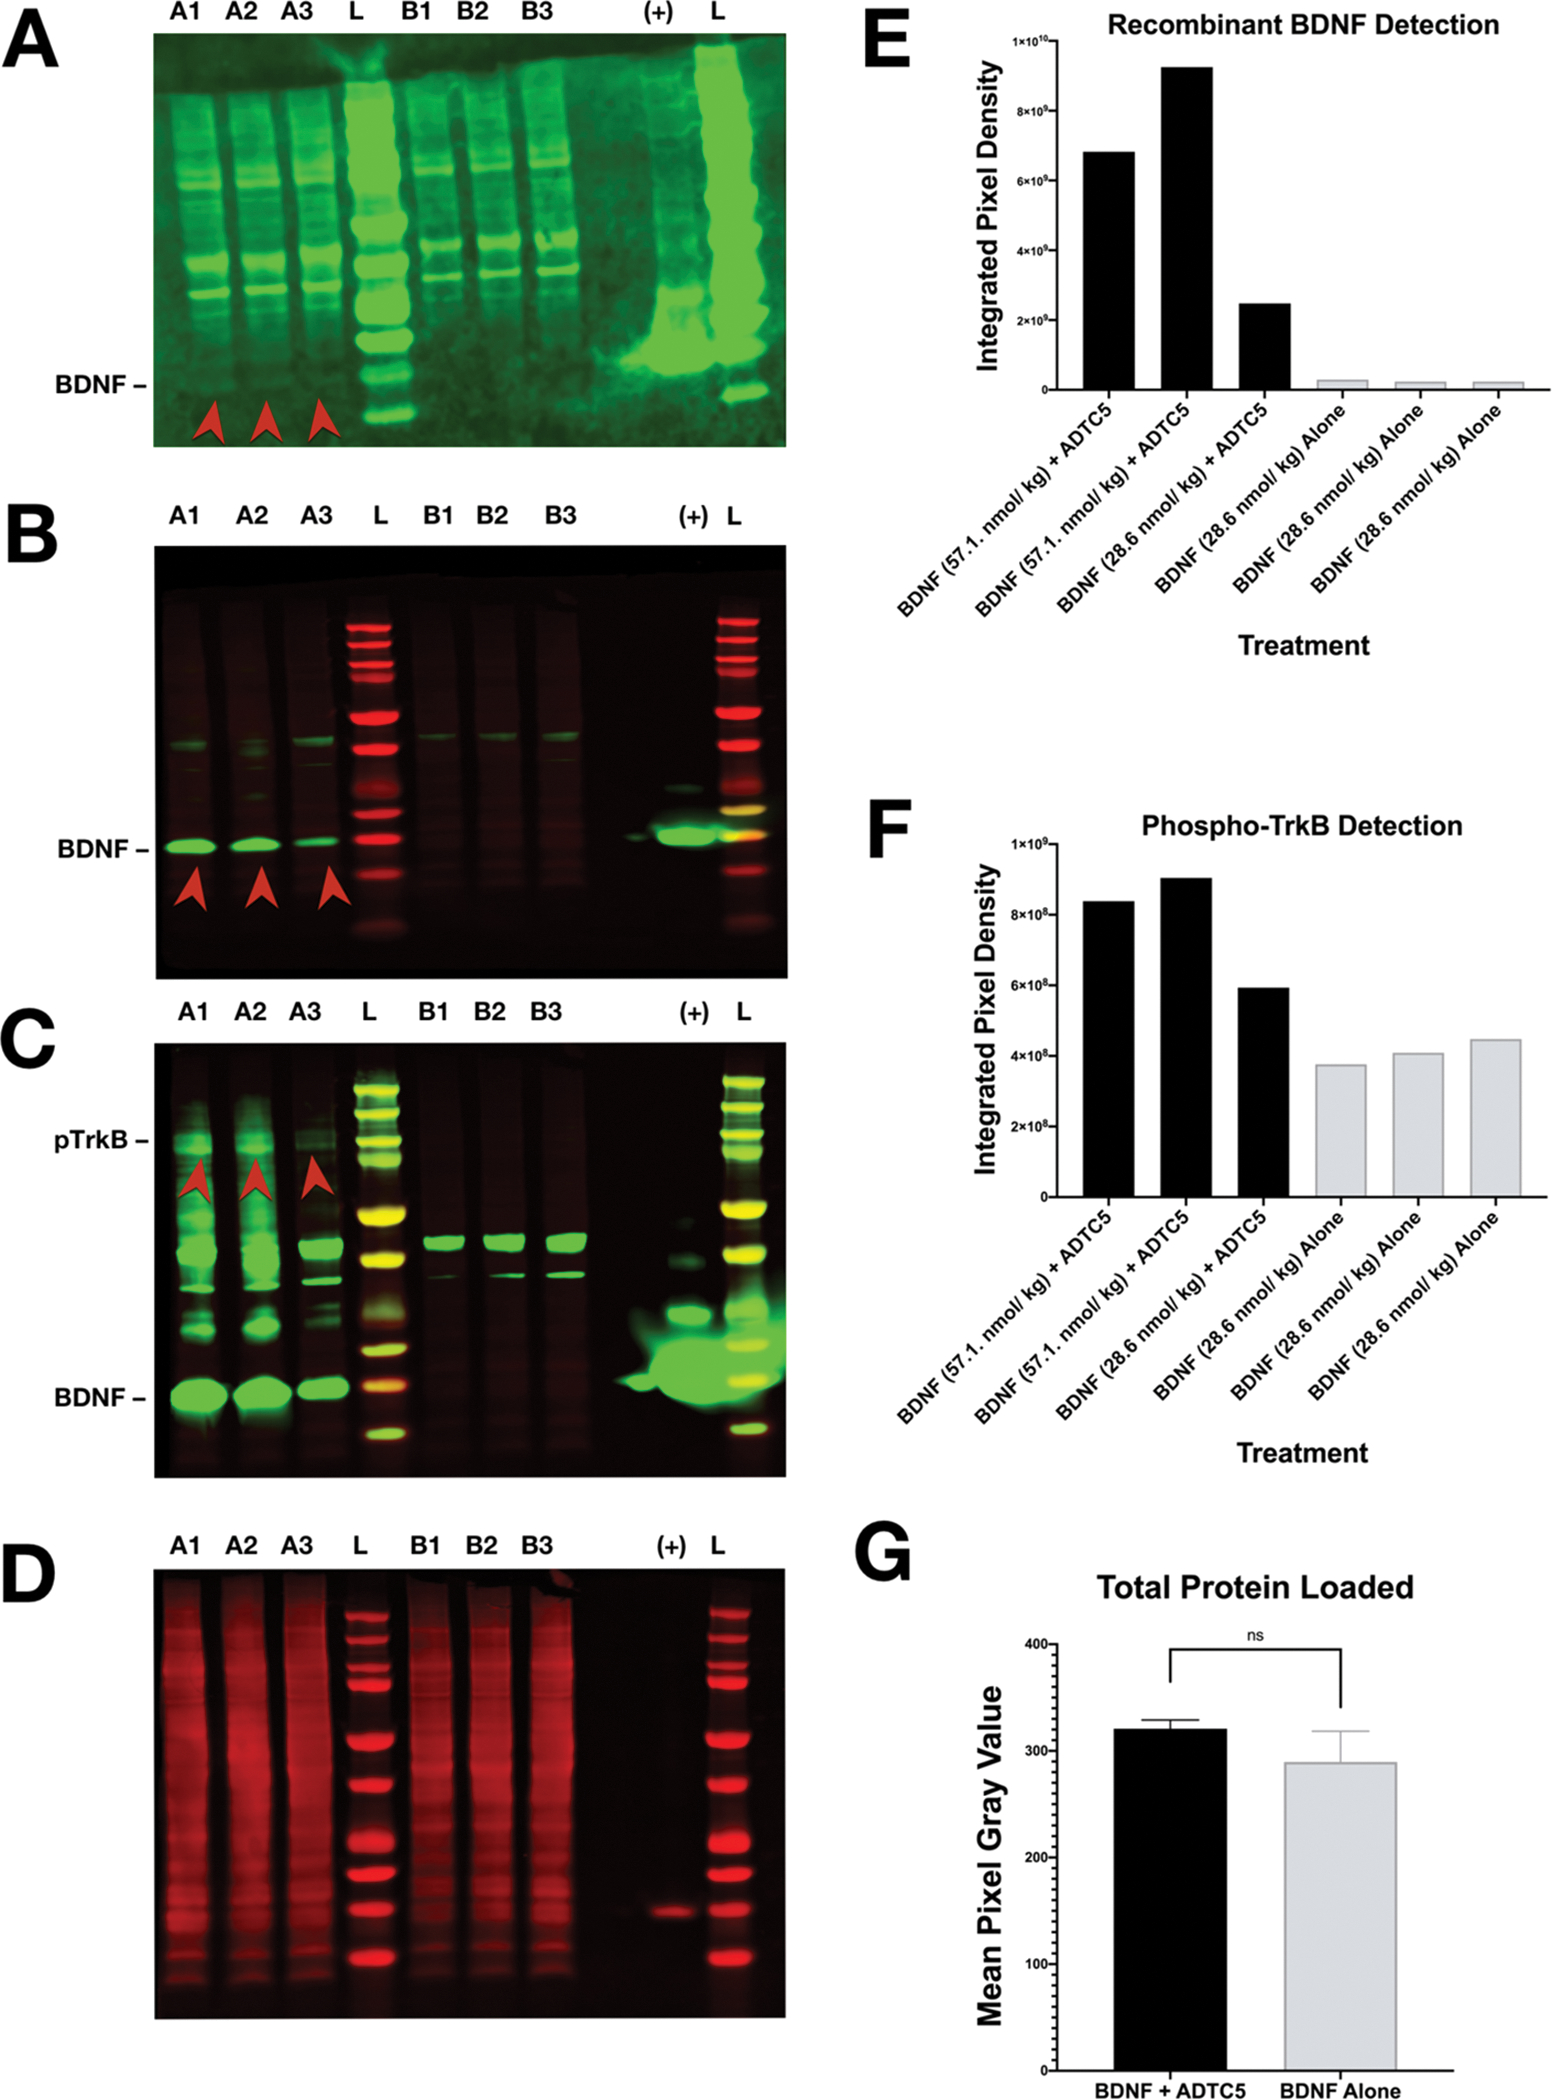
Western blot detection of recombinant BDNF and pTrkB from mice treated with either BDNF + ADTC5 or BDNF alone. (A) Western blot probing for recombinant BDNF in the brains of mice that received BDNF (5.71 nmol/kg) + ADTC5 (10 μmol/kg; A1, A2, A3) or BDNF alone (5.71 nmol/kg, B1, B2, B3); “L” represents molecular weight ladder; “+” represents the positive control of recombinant BDNF; the red arrows highlight increased recombinant BDNF detection. (B) Western blot probing for recombinant BDNF after dosage increase in healthy mice that received BDNF (57.1 nmol/kg) + ADTC5 (10 μmol/kg; A1, A2), BDNF (28.6 nmol/kg) + ADTC5 (10 μmol/kg; A3), or BDNF alone (28.6 nmol/kg; B1, B2, B3); the red arrows highlight increased recombinant BDNF detection. (C) Western Blot probing for pTrkB after dosage increase of healthy mice that received BDNF (57.1 nmol/kg) + ADTC5 (10 μmol/kg; A1, A2), BDNF (28.6 nmol/kg) + ADTC5 (10 μmol/kg; A3), or BDNF alone (28.6 nmol/kg; B1, B2, B3); the red arrows highlight increased pTrkB detection. (D) Total protein stain (loading control) for samples treated with BDNF 57.1 nmol/kg or 28.6 nmol/kg in (B) and (C). (E) Graphical representation of recombinant BDNF detection level in mice that received BDNF (57.1 nmol/kg) + ADTC5 (10 μmol/kg; A1, A2), BDNF (28.6 nmol/kg) + ADTC5 (10 μmol/kg; A3), or BDNF alone (28.6 nmol/kg; B1, B2, B3). (F) Graphical representation of pTrkB detection level for mice that received BDNF (57.1 nmol/kg) + ADTC5 (10 μmol/kg; A1, A2), BDNF (28.6 nmol/kg) + ADTC5 (10 μmol/kg; A3), or BDNF alone (28.6 nmol/kg; B1, B2, B3). (G) Graphical representation of total protein loaded among all groups. Contrast and brightness of images were adjusted only for display purposes.