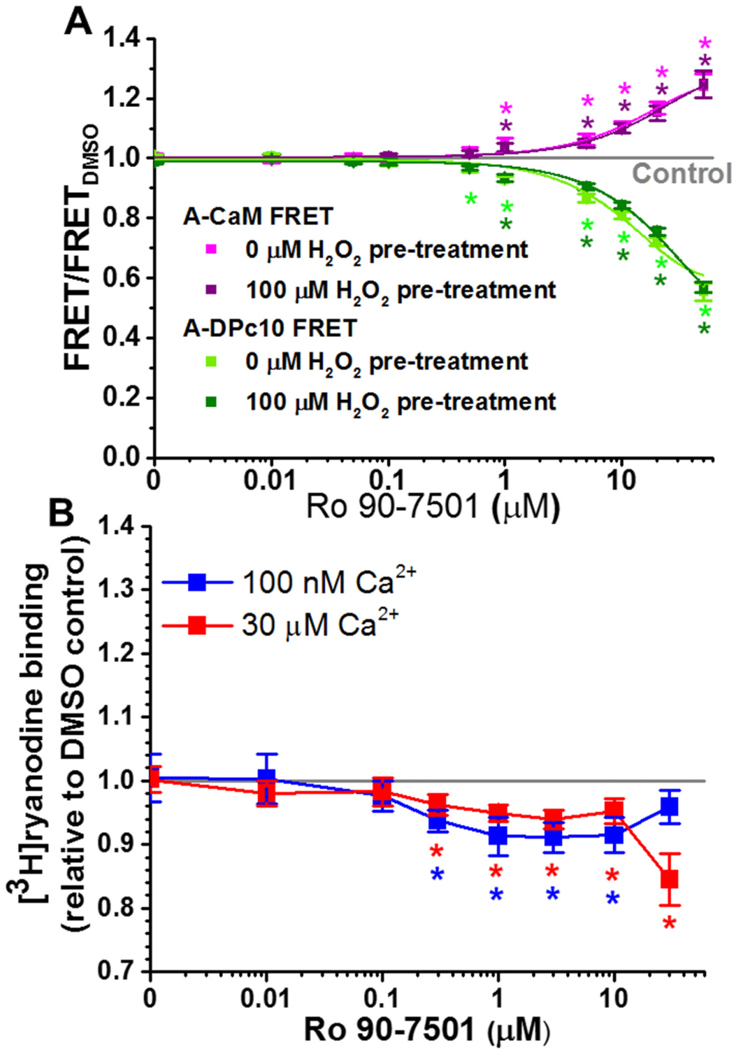
Fig. 4.
Dose-dependent effects of Ro 90–7501. (A) Normalized FLT-FRET response to the indicated Ro 90–7501 concentrations using cardiac SR and A-CaM (purple) or A-DPc10 (green), at 30 nM Ca2+ following pre-treatment with no H2O2 (light colors), and 100 μM H2O2 (dark colors). (B) Response of RyR2 [3H]ryanodine binding to the indicated concentrations of Ro 90–7501, in 100 nM (blue) or 30 μM (red) free Ca2+. Data are normalized relative to the values for no-drug DMSO control (grey line), means ± SEM, n = 3. *P < 0.05 vs. DMSO by 2-sided Student’s unpaired t-test. (For interpretation of the references to colour in this figure legend, the reader is referred to the web version of this article.)

