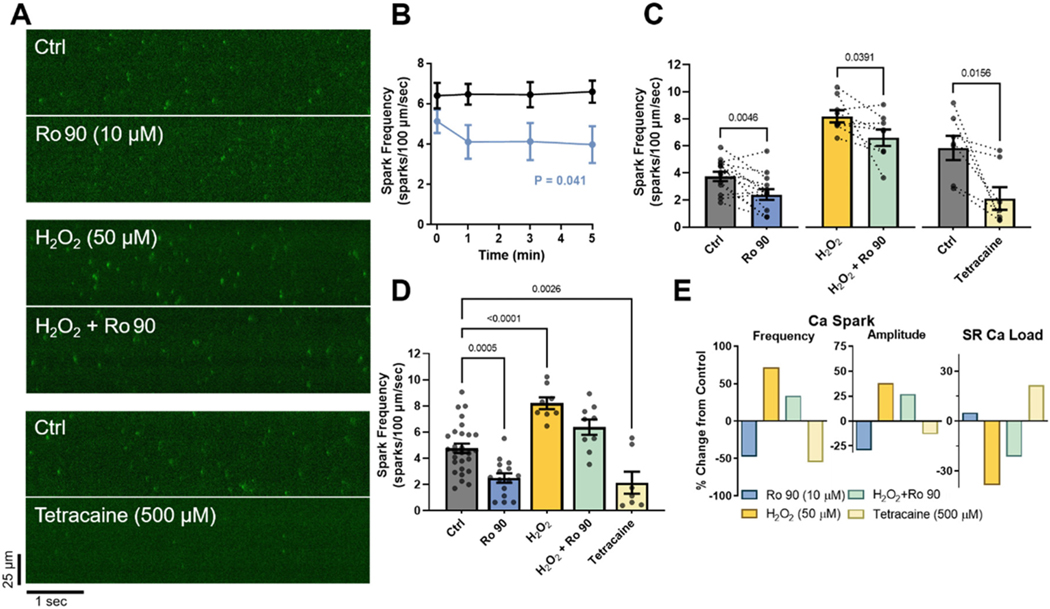
Fig. 6.
Ro 90–7501 effect on Ca2+ spark rate in permeabilized rat myocytes. (A) Representative paired line-scan recordings (6 s) of Ca2+ sparks response to acute exposure (5 min) to 10 μM Ro 90–7501 or 500 μM tetracaine treatment, as indicated, under either control (Ctrl) conditions or following 50 μM H2O2 pretreatment (1 h). Colour display scales span the fluorescence range of Ca2+ sparks. (B) Time course of average (±SEM, n/N (# of cells/# of animals) = 7/4 Ctrl, 9/4 Ro 90–7501) Ca2+ spark frequencies (CaSpF) with and without 10 μM Ro 90–7501 treatment over 5 min (repeated measures two-way ANOVA with Geisser-Greenhouse correction; Dunnett multiple comparison post-hoc test). (C) Explicit paired comparisons of CaSpF before or after 5 min exposures to either Ro 90 or tetracaine, with or without H2O2 pretreatment (Wilcoxon matched-pairs rank tests, n/N = 13/7, 8/3 and 7/3, respectively). (D) CaSpF for individual groups, including unpaired measures, analyzed via one-way ANOVA vs. Ctrl and Dunnett’s multiple comparison post-hoc test (n/N = 28/11, 15/7, 8/3, 9/3, 7/3, respectively). (E) Percent change in average Ca2+ spark frequency and amplitude relative to respective control averages, and in average SR Ca2+ load relative to control average. Statistical analyses were performed using GraphPad Prism 9 software.

