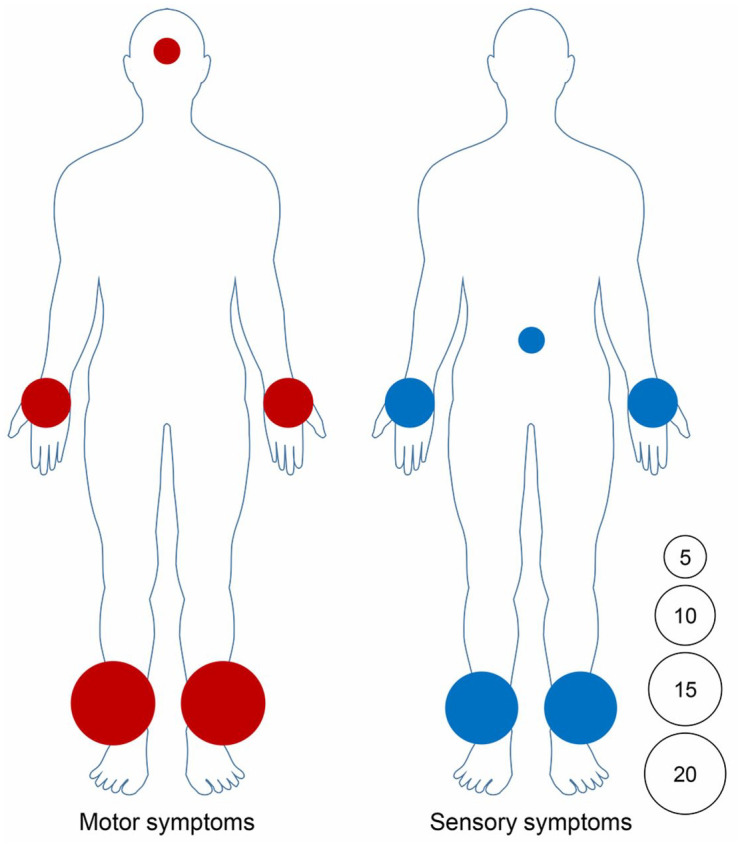
Figure 2.

Motor and sensory symptoms distribution in 21 patients.
The area of circle represents the relative frequency of motor and sensory symptoms involvement in different body areas. The number in the circle represents the number of affected patients.
