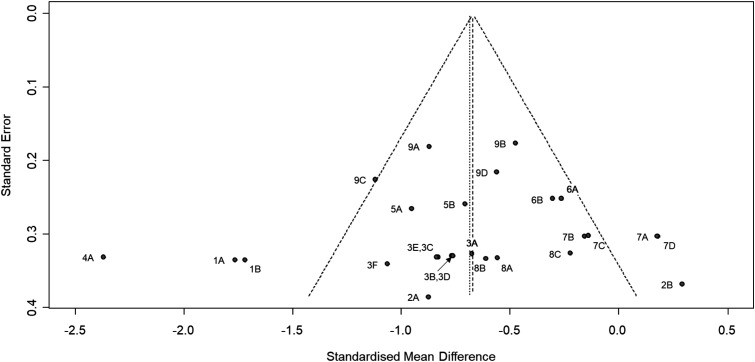
Figure 3.
Funnel plot of effect size estimates (Hedges’ g). The effect size estimates are shown with 95% confidence interval relative to standard error for individual data sets. The point labels correspond to the study labels in Figure 2. The left-most vertical line represent the standardised mean difference under the random-effects model, and the other vertical line (under the triangle) represent the standardised mean difference under the fixed-effects model.

