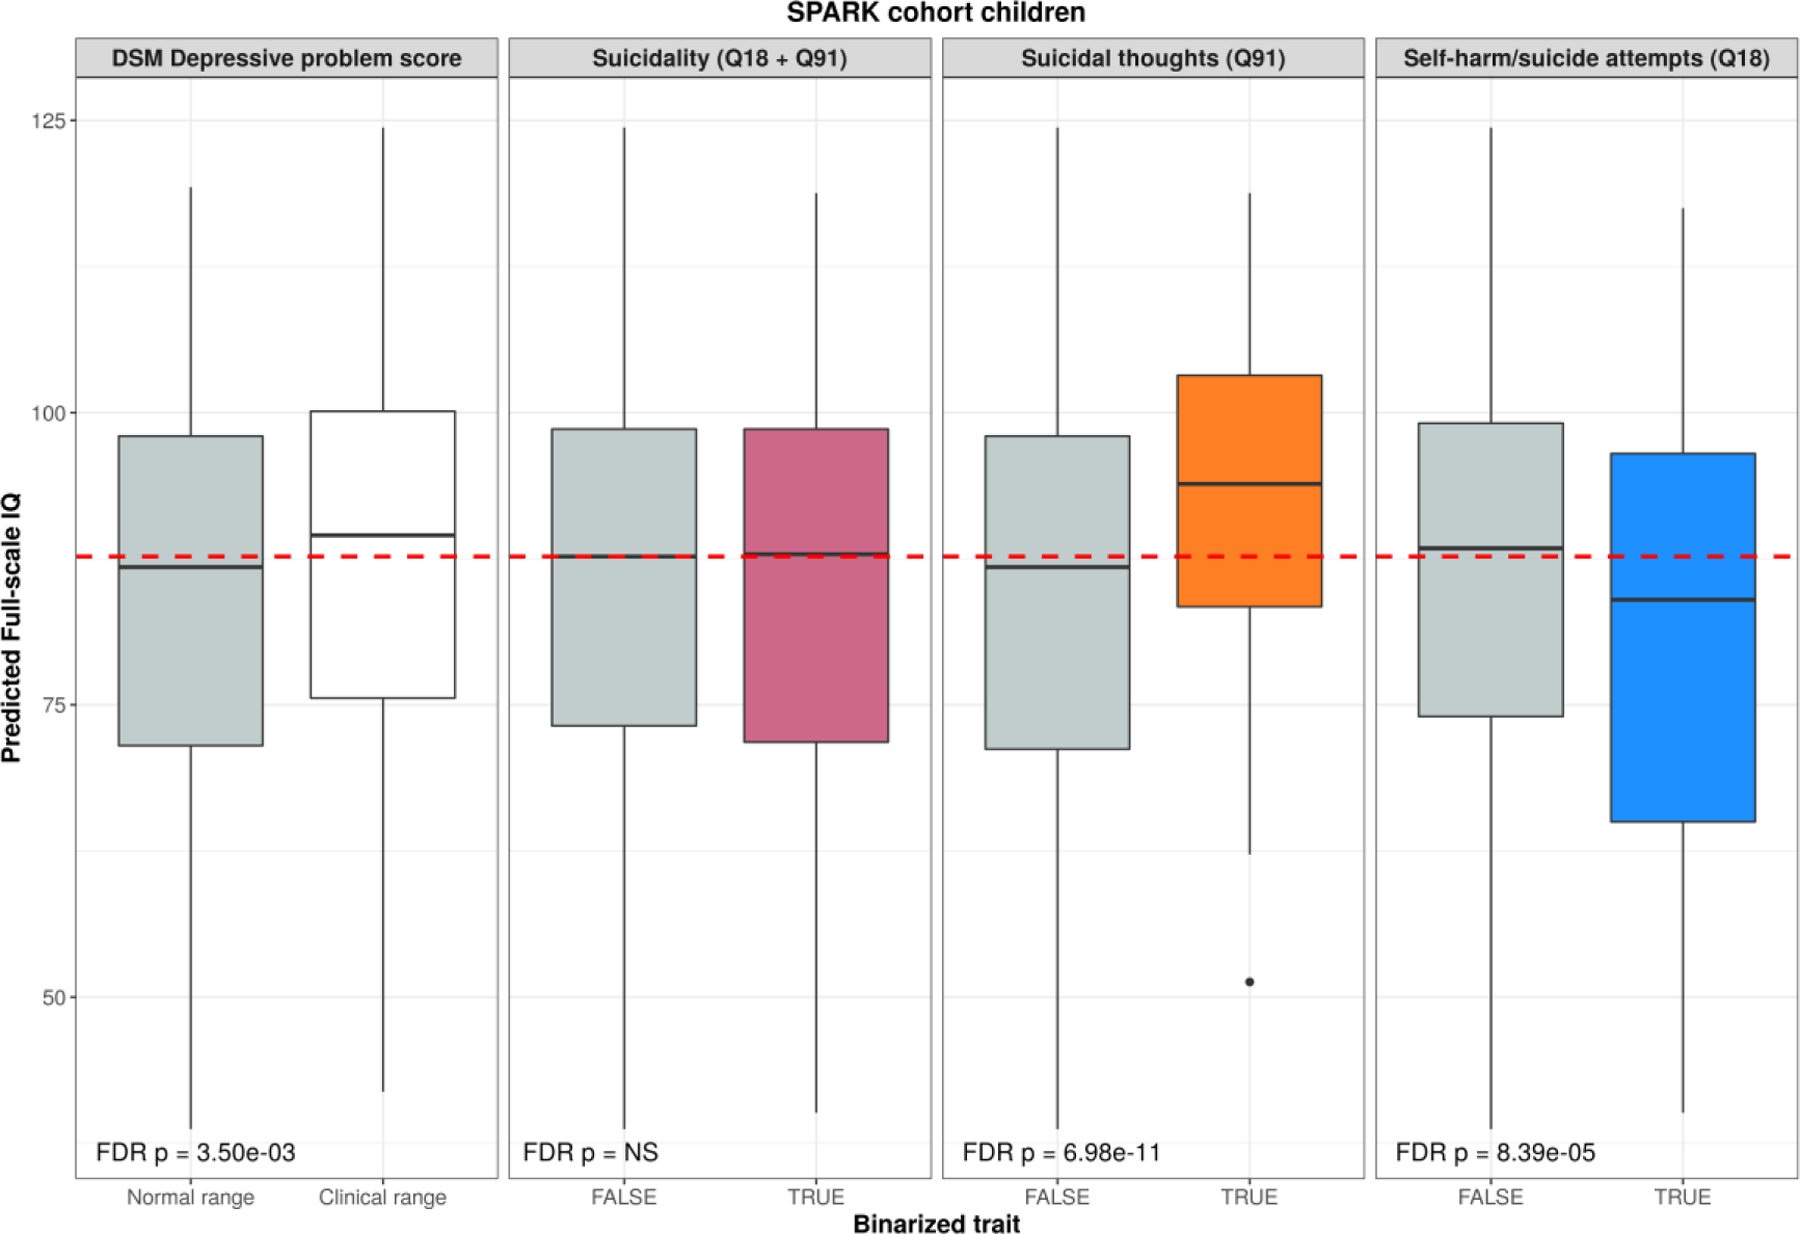
Fig. 3. Imputed full-scale IQ scores are related to depressive phenotypes.

Distributions of behaviorally-predicted IQ score split by depressive phenotypes in autistic children from SPARK. The red dashed line shows the median predicted IQ scores for this sample. FDR-corrected p-values from Wilcoxon tests are reported in the bottom of each boxplot.
