Figure 5.
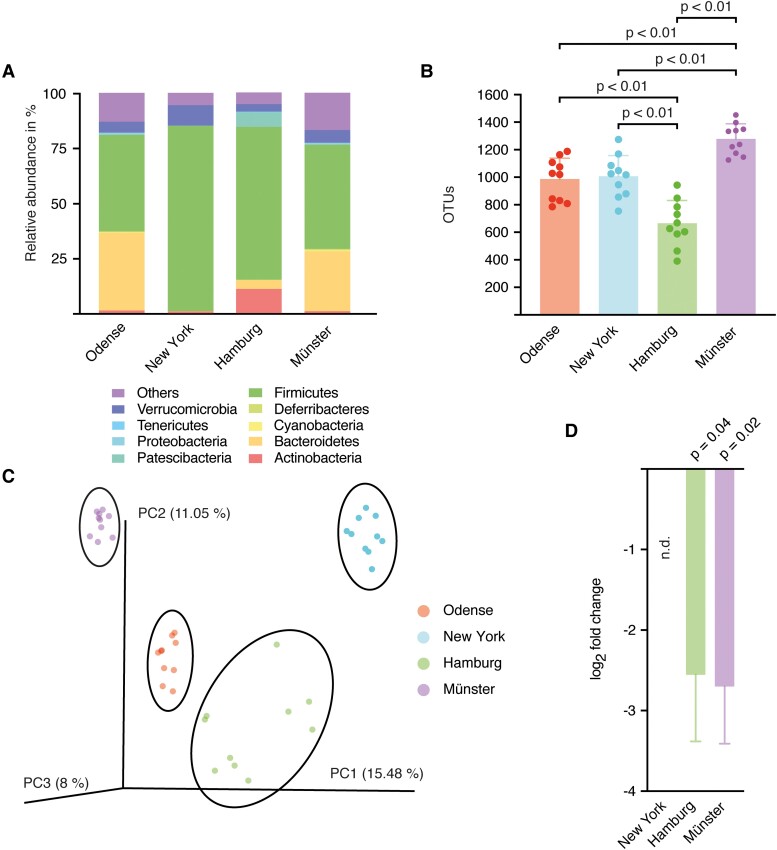
The microbiome differed between the four centres. (A) Taxonomic summary of OTUs on phylum level, n = 10 from each centre. (B) Total numbers of OTUs for each centre. Graphs show mean ± SD. Statistical significance was assessed by pairwise Student’s t-tests for independent samples (New York versus Odense: t = 0.29, P = 1; New York versus Hamburg, t = 4.76, P = 0.001; New York versus Münster: t = −4.55, P = 0.004; Hamburg versus Odense: t = −4.48, P = 0.002; Hamburg versus Münster: t = −9.65, P < 0.001; Münster versus Odense: t = −4.88, P = 0.001; n = 10 in each centre). (C) Principal coordinate analysis (PCoA) of the family composition. Clusters of each centre are highlighted with an ellipse. Statistical testing was performed with an analysis of similarities (R = 0.78, P < 0.001, n = 40). (D) qPCR analysis for SFB presence in mice from the four different centres. Expression levels were normalized to corresponding SFB levels in mice from Odense. Log2 fold changes are shown as mean ± SD. SFB were not detectable in the New York cohort. Statistical significance was assessed by Student’s t-tests for independent samples (Hamburg: t(14) = 2.23, P = 0.04, n = 16; Münster: t(16) = 2.58; P = 0.02, n = 18).

