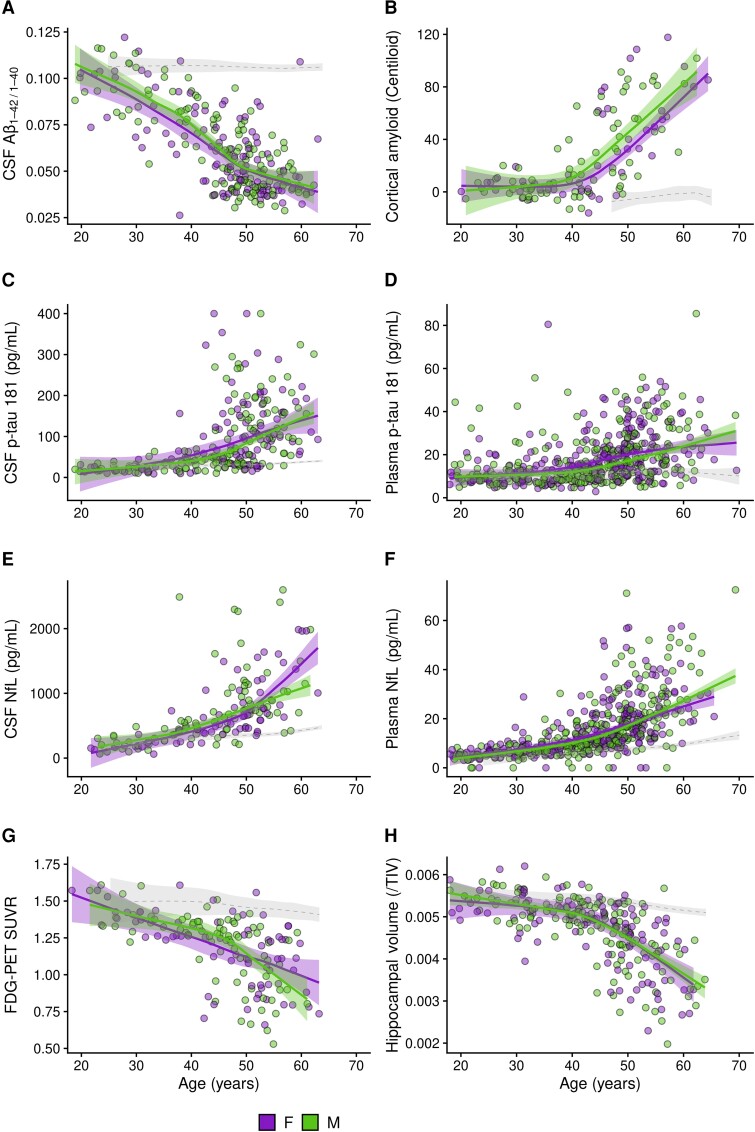
Figure 2.
Association of biological sex with Alzheimer’s disease biomarkers in adults with Down syndrome. Shading represents 95% confidence intervals. The dotted lines represent the age-related changes in euploid individuals (healthy controls) for visual reference. A significant difference between LOESS curves was defined as the age at which the curves diverged visually, and the 95% confidence intervals did not overlap (P < 0.05). The scatterplots display, for males and females separately, the relationship between age and CSF Aβ42/40 (A), amyloid-PET (B), CSF and plasma p-tau181 (C, D), CSF and plasma NfL (E, F), FDG-PET (G) and hippocampal volume (H). Aβ40, amyloid β peptide 40; Aβ42, amyloid β peptide 42; CSF, cerebrospinal fluid; FDG, ¹18F-fluorodeoxyglucose; NfL, neurofilament light chain; SUVR, standardized uptake value ratio; TIV, total intracranial volume; F, female; M, male.

