Figure 2.
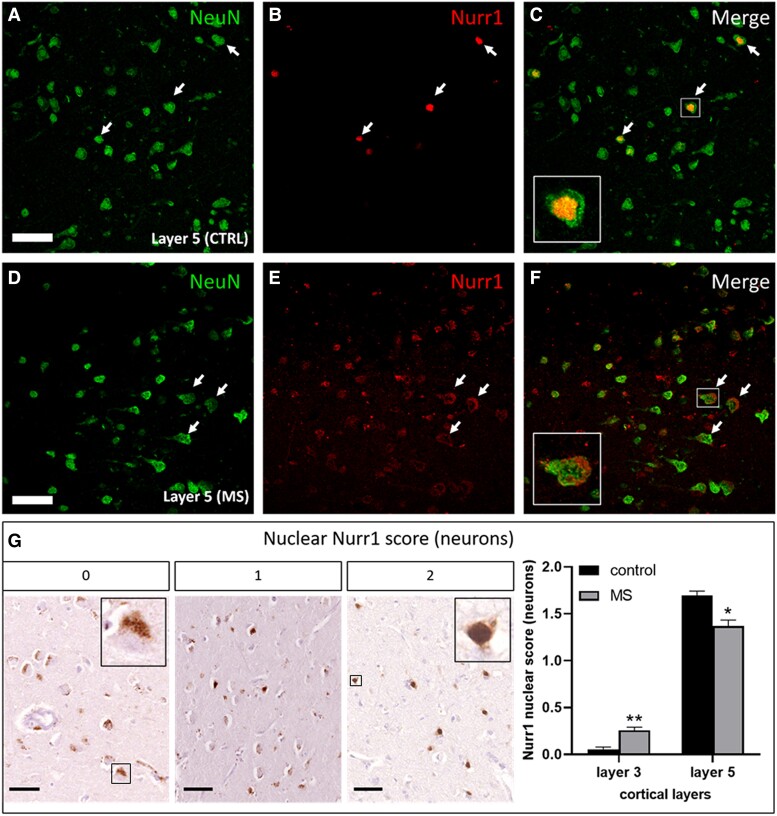
Representative NeuN+ and Nurr1+ neurons and semi-quantitative scoring on Nurr1 neuronal localisation. Confocal images of layer 5 pyramidal neurons in (A–C) control and (D–F) multiple sclerosis cases are labelled for NeuN (NeuN; A, D) and Nurr1 (Nurr1; B, E) at 400 × magnification, and representative merge image (C, F). Nuclear and cytoplasmic Nurr1 are illustrated in the inserts (arrows and inserts in C and F, respectively; scale bar 50 µm). (G) We devised a semiquantitative score for the localisation of Nurr1 in cytoplasm and nucleus of neurons in layer 3 and layer 5. For each FOV analysed, Nurr1 expression in each compartment was scored on a scale of 0 (mostly cytoplasmic), 1 (cytoplasmic/nuclear) and 2 (mostly nuclear). Cytoplasmic Nurr1 is greater in layer 3 of controls compared with multiple sclerosis cases, while nuclear Nurr1 is greater in layer 5 of controls compared with multiple sclerosis cases (Mann-Whitney tests). Cytoplasmic and nuclear Nurr1 are illustrated in the inserts of score 0 and score 1, respectively. Data presented as mean ± SEM. *P < 0.05; **P < 0.01; scale bar 100 μm.

