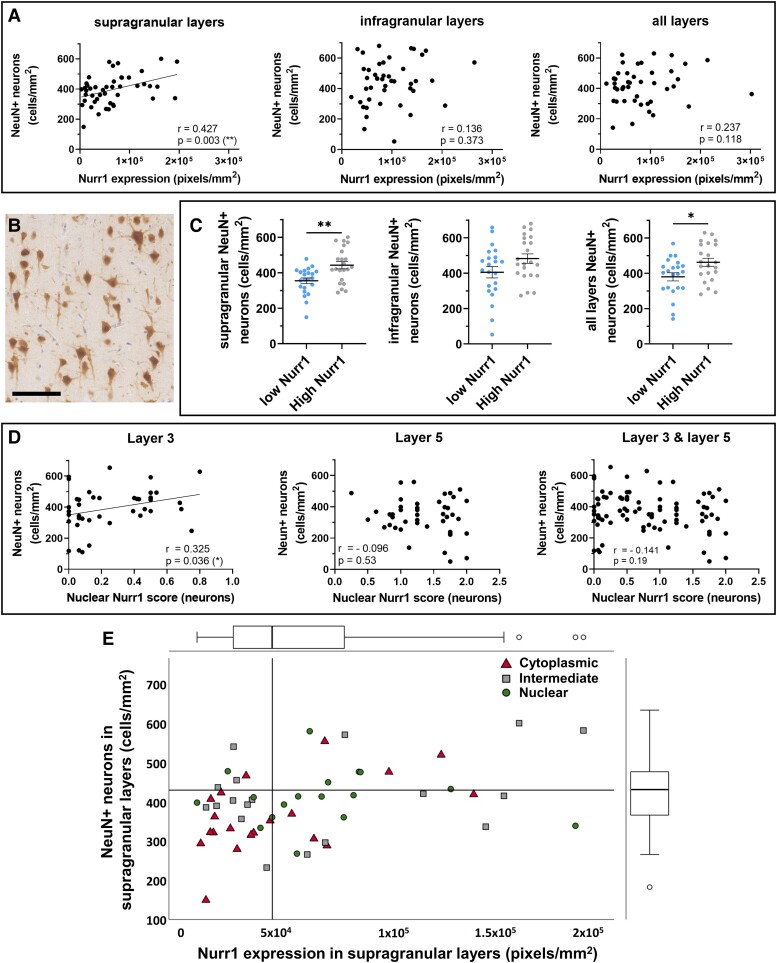
Figure 3.
Relationships between Nurr1 expression and neuronal localisation with neuronal density in multiple sclerosis. Nurr1 expression is positively correlated with (A) NeuN+ neuronal density, which is restricted to supragranular layers in multiple sclerosis (Spearman rank-correlation coefficients). (B) Representative labelling of NeuN+ neurons using DAB immunostaining in supragranular layer 3 in multiple sclerosis (scale bar 100 μm). (C) Further assessment shows an increase in NeuN+ neuronal density in the multiple sclerosis subgroup with high levels of Nurr1, restricted to supragranular layers (Mann-Whitney tests) (D) Nurr1 preferential localisation in nucleus is positively correlated with NeuN+ neuronal densities and restricted to superficial layer 3 (Spearman rank-correlation coefficients). (E) Nurr1 expression and sub-cellular localisation interact in predicting NeuN+ neuronal densities, as cases with low NeuN+ neuron densities (below median, horizontal line) tend to have both low Nurr1 expression (below median, vertical line) and a cytoplasmic Nurr1 expression (Generalised estimating equation model). The scatterplot shows the relationship between Nurr1 expression and NeuN+ neuronal density. Dots are classified based on the Nurr1 localisation score as predominant cytoplasmic (higher tertiles), intermediate or nuclear Nurr1 expression (bottom tertiles). Distribution of Nurr1 expression (on top) and NeuN+ neuronal densities (on the right) are represented with box plots. Data presented as mean ± SEM. *P < 0.05; **P < 0.01; scale bar 100 μm.

