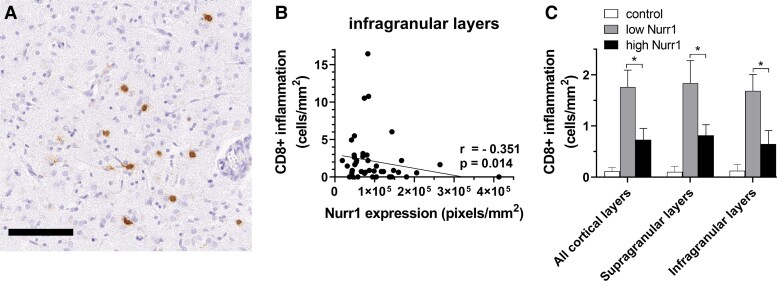
Figure 4.
Relationships between Nurr1 expression and CD8+ lymphocyte density. (A) Representative labelling of CD8+ cells using DAB immunostaining. (B) A negative correlation between Nurr1 expression and CD8+ lymphocytes is restricted to infragranular layers in multiple sclerosis cohort (Spearman rank-correlation coefficients). (C) Further assessment shows a significant increase in CD8+ lymphocytes in the cases lying at the lowest extreme of Nurr1 expression (n = 20) compared with the cases with the highest extreme of Nurr1 expression throughout all cortical layers (Mann-Whitney tests). *P < 0.05; scale bar 100 μm.

