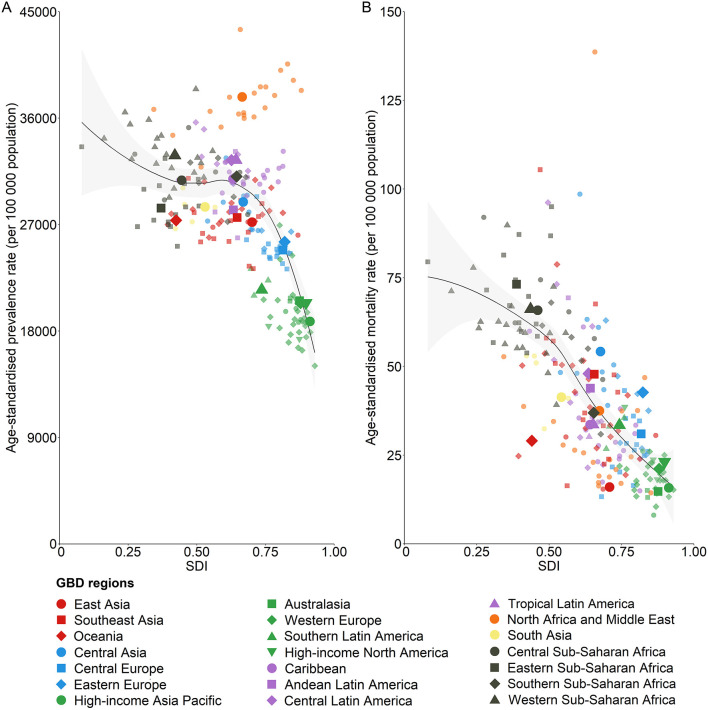
Figure 5.
The association between SDI and digestive disease age-standardized prevalence rate (A) and mortality rate (B) for both sexes combined, 2019. Each color represents one of the seven GBD super-regions (red represents southeast Asia, east Asia, and Oceania; blue represents central Europe, eastern Europe, and central Asia; green represents high-income; purple represents Latin America and the Caribbean; orange represents North Africa and the Middle East; yellow represents south Asia; and gray represents sub-Saharan Africa). Lighter-colored point estimates without labels in the legend represent countries. The black lines represent locally weighted smoothing based on country-level data, and the gray shading represents locally weighted smoothing of country-level 95% uncertainty intervals. GBD, Global Burden of Disease, Injuries, and Risk Factors Study; SDI, Sociodemographic Index.

