Fig. 2.
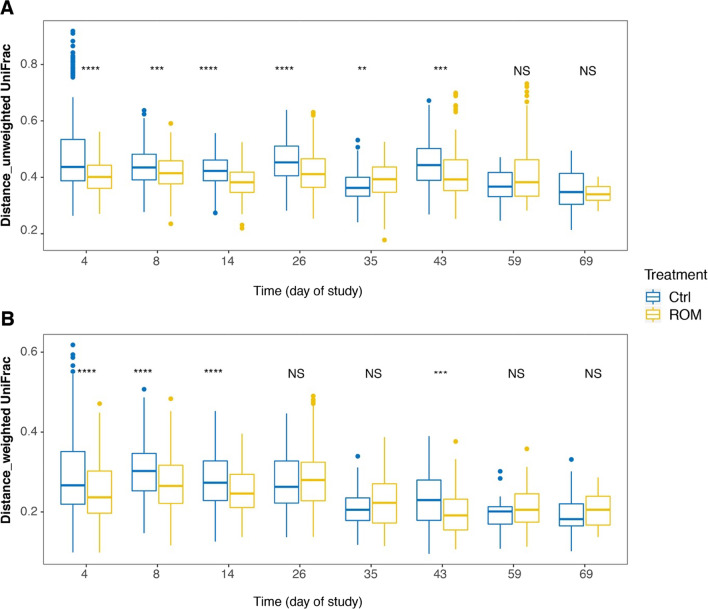
The effect of ROM treatment on faecal microbial inter-individual variation. Boxplots show the inter-individual variation for ROM versus Ctrl pigs in faecal microbial composition over time based on unweighted (A) and weighted (B) UniFrac distances. Significance between treatments was assessed by Wilcoxon rank sum test per time point. Asterisks are used to indicate the statistical differences between treatments (**p < 0.01, ***p < 0.001, ****p < 0.0001). Blue and yellow colours represent control (Ctrl) and treated (ROM) groups, respectively

