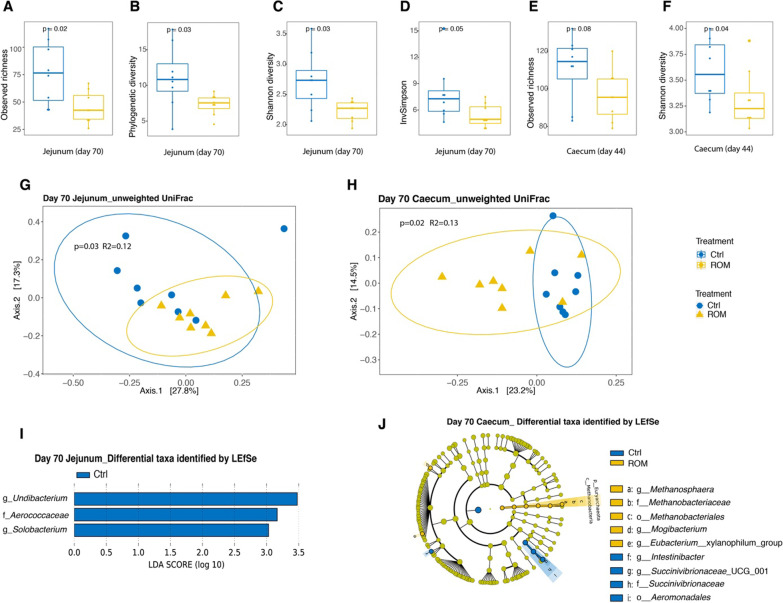
Fig. 4.
The effect of ROM treatment on luminal microbiota colonization. Boxplots show comparisons of jejunal luminal microbial alpha diversity between ROM and Ctrl groups on day 70 based on observed richness (A), phylogenetic diversity (B), Shannon diversity (C) and inverse Simpson (InvSimpson) (D), as well as caecal luminal microbial diversity between two groups on day 44 with indices of observed richness (E) and Shannon diversity (F). Differences in alpha diversity between groups were evaluated by nonparametric Wilcoxon rank sum test. Principal coordinate analysis (PCoA) plots for jejunal luminal microbiota (G) and caecal luminal microbiota (H) at ASV level both on day 70 based on unweighted UniFrac. Significance of the difference between ROM and Ctrl groups was assessed using PERMANOVA. The percentages at the axes indicate the variation explained. Linear discriminant analysis (LDA) Effect size (LEfSe) of differentially abundant jejunal taxa between ROM and Ctrl groups on day 70 (I). Cladogram of caecal differentially abundant taxa between ROM and Ctrl pigs on day 70 according to LEfSe (J). Blue and yellow colours represent control (Ctrl) and treated (ROM) groups, respectively

