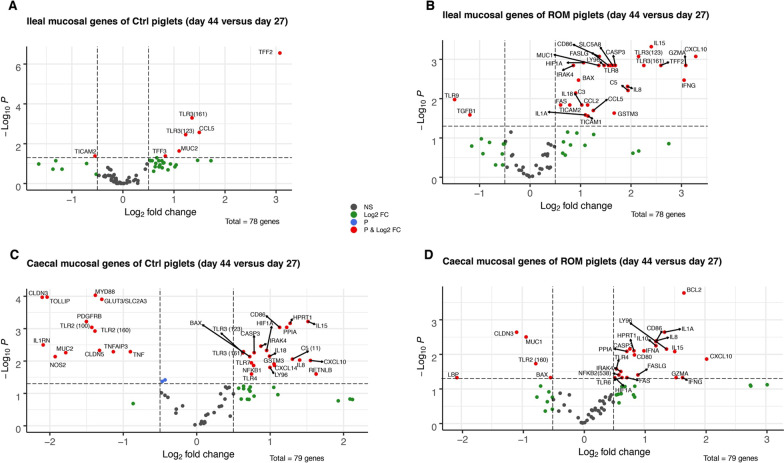
Fig. 6.
Volcano plots of all expressed genes in mucosa collected from ileum of Ctrl- (A) and ROM (B) piglets, as well as from caecum of Ctrl- (C) and ROM (D) piglets by comparisons between day 44 and day 27 within each group. The x-axis is the log2 fold change (log2 FC) for the ratio day 44 versus day 27 and the y-axis is the − log10 p value that was adjusted by FDR for multiple testing. The red dots represent genes that were either significantly more (positive fold-change) or less (negative fold-change) expressed on day 44 versus day 27 for the respective location and experimental group, with adjusted p ≤ 0.05 and a log2 FC > 0.5. Blue points indicate differentially expressed genes with an adjusted p < 0.05 and a log2 FC < 0.5. Green points indicate differentially expressed genes with adjusted p > 0.05 and a log2 FC > 0.5

