Fig. 8.
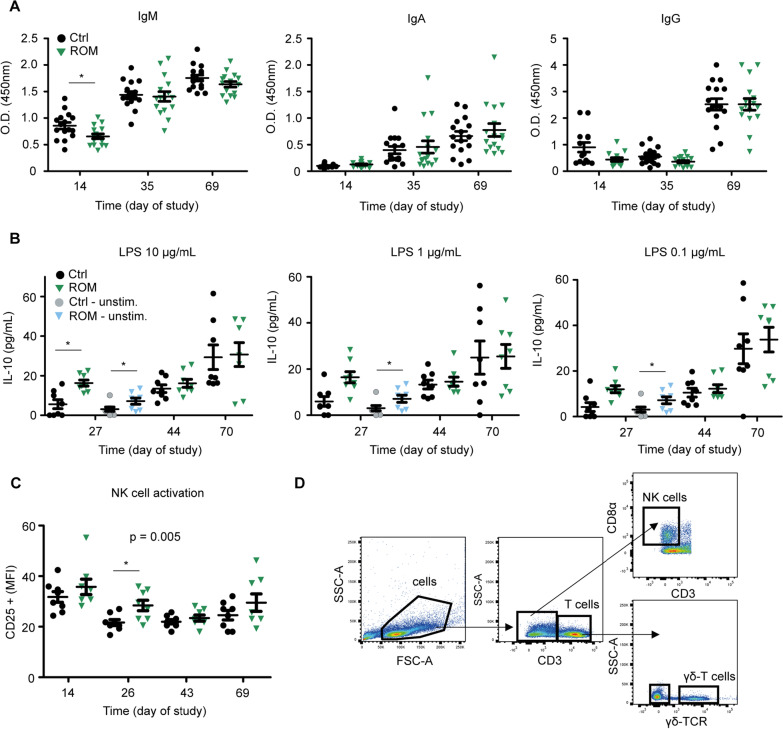
Immunological analysis. A Serum levels of Salmonella-specific IgM, IgA, and IgG prior to vaccination (day 14), 2 weeks after the initial vaccination (day 35), and 3 weeks after the booster vaccination (day 69). B IL-10 production upon ex vivo stimulation of MLN cells. MLN cells were stimulated for 24 h with 10, 1, and 0.1 μg/mL of LPS, or left unstimulated (cell culture medium only). C Activation of Natural Killer cells in PBMCs. D Gating strategy to identify Natural Killer cells. p values indicate significant differences between treatment groups over time, and asterisks are used to indicate significant differences between treatment groups after taking into account single time points (*p < 0.05). Every point represents an individual animal from a separate pen (n = 7 or 8 per treatment group), and error bars represent standard deviations. Normal distribution and equal variances of data were checked and log-transformed when necessary. No differences in IL-10 production by unstimulated MLN cells were observed post-weaning and are therefore not presented

