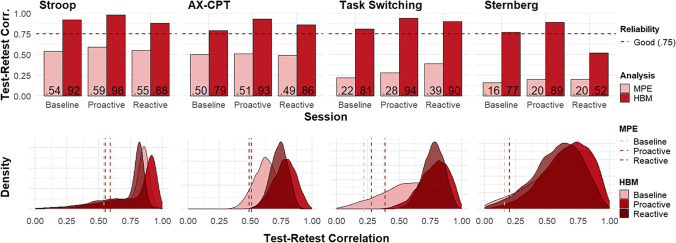
Fig. 3.
Test–retest reliability estimates of the difference score parameter. Note. Distribution of observed reliability estimates, split by analysis type for comparison. Density plot to visualize uncertainty of HBM delta estimate, dashed line of respective MPE estimates for comparison of reliability magnitude. MPE Pearson correlation coefficient obtained from traditional mean point estimates approach; HBM Pearson correlation coefficient of delta estimates obtained by hierarchical Bayesian modeling. n ranges between 104 and 122; different n sample sizes due to additional multivariate outlier removal

