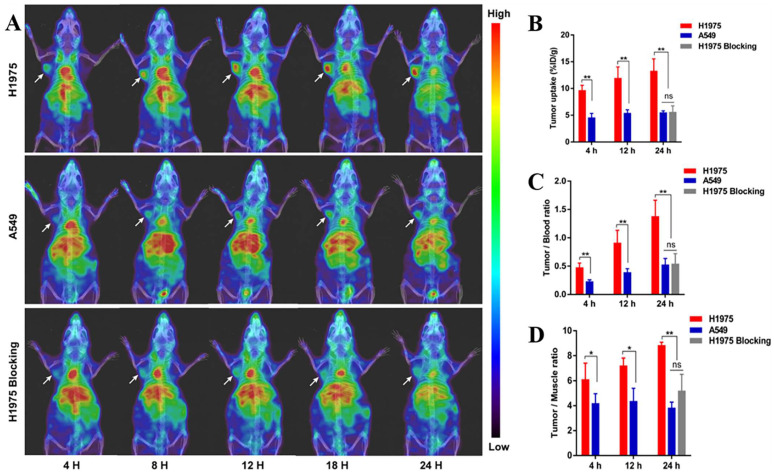
Figure 11.
(A) SPECT/CT images of H1975, A549, and H1975 blocking tumor-bearing mice at 4, 8, 12, 18, and 24 h administered with [99mTc]Tc-HYNIC-KN035. (B) Tumor uptake of [99mTc]Tc-HYNIC-KN035 in H1975, A549, and H1975 blocking groups. The tumor/blood ratio (C) and tumor/muscle ratio (D) in H1975, A549, and H1975 blocking groups. (Cited from reference 133, with permission by ACS.)

