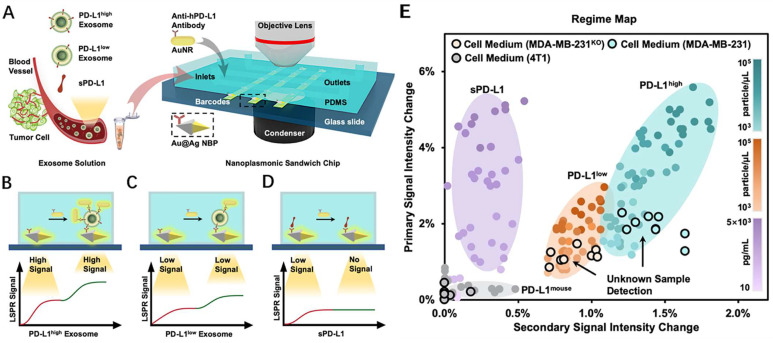
Figure 9.
(A) Detection procedure of the nanoplasmonic sandwich immunoassay. (B-D) Quantification and subclass identification of exosomes based on the generated primary (red curves) and secondary (green curves) LSPR signals. (E) Regime map for exosome subtyping and unknown sample detection. (Cited from reference 119, with permission by ACS.)

