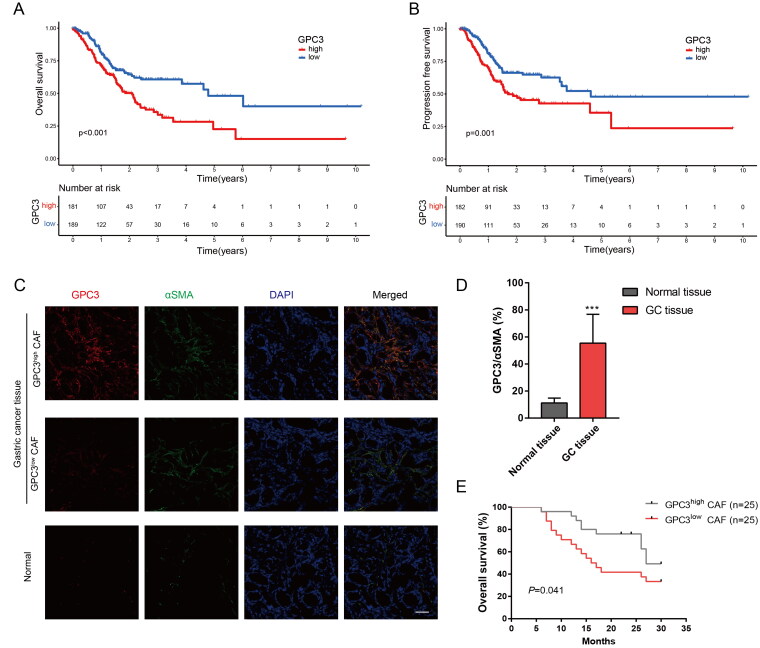
Figure 4.
GC with GPC3high CAFs is correlated with poor prognosis. (A,B) Kaplan–Meier survival curve shows the relationship between high- and low-GPC3 expression and GC prognosis with TCGA dataset. (C) Immunofluorescence were used to detect the GPC3 expression in CAFs of GC tissue and normal tissue (bar = 50 μm). (D) Comparison between the GPC3 expression level in CAFs of GC tissue and normal tissue. (E) Kaplan–Meier survival curve shows the relationship between high- and low-GPC3 expression in CAFs and OS of GC patients (***p < .001).

