Figure 5.
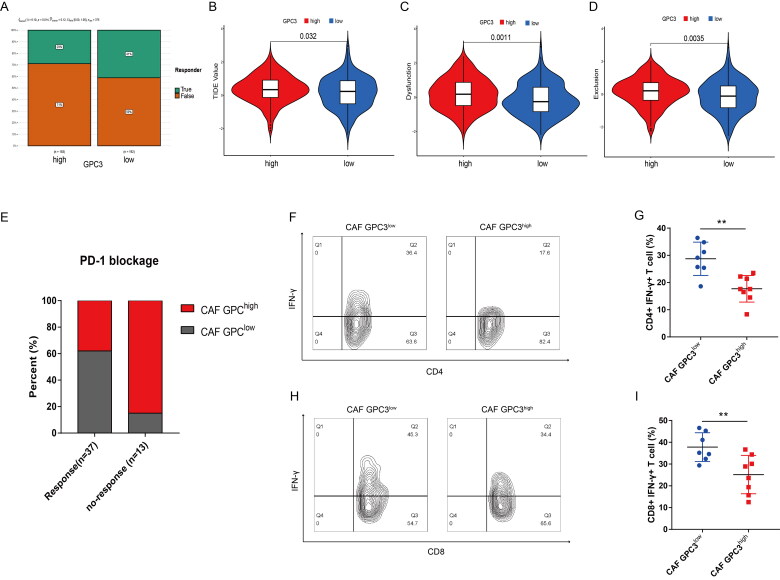
GC with GPC3high CAFs is correlated with lower response of PD-1 blockage therapy. (A) The likelihood of the clinical response to anti-PD-1 therapy for high and low GPC3 expression GC patients from the TCGA cohorts. True represents immunotherapy responders, while false represents immunotherapy nonresponders. (B–D) The violin plots present of TIDE value, immune dysfunction and immune exclusion in high and low GPC3 expression GC patients. (E) The relationship between different GPC3 expression in CAFs and the response ratio of anti-PD-1 therapy in GC patients. (F–I) The proportion of interferon (IFN)-γ-positive cells of CD4+ or CD8+ T cells in the tumours with different GPC3 expression in CAFs.

