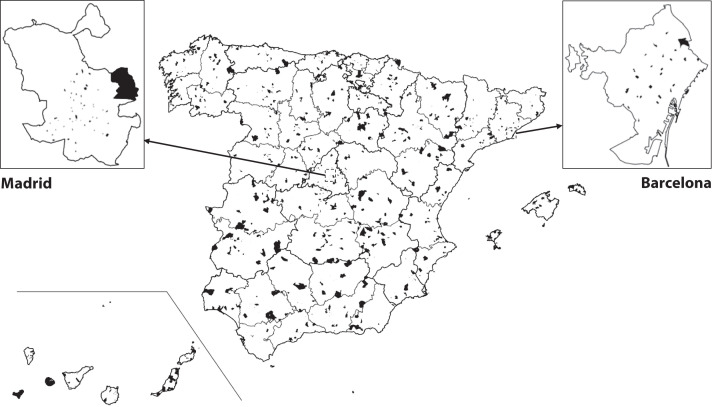
FIGURE 1—
Distribution of Selected Census Tracts by Province in the Seroepidemiological Survey of SARS-CoV-2 Virus Infection in Spain (ENE-COVID): 2020
Note. Selected census tracts are represented by black areas. Census tracts selected in the largest municipalities (Madrid and Barcelona) are shown separately.

