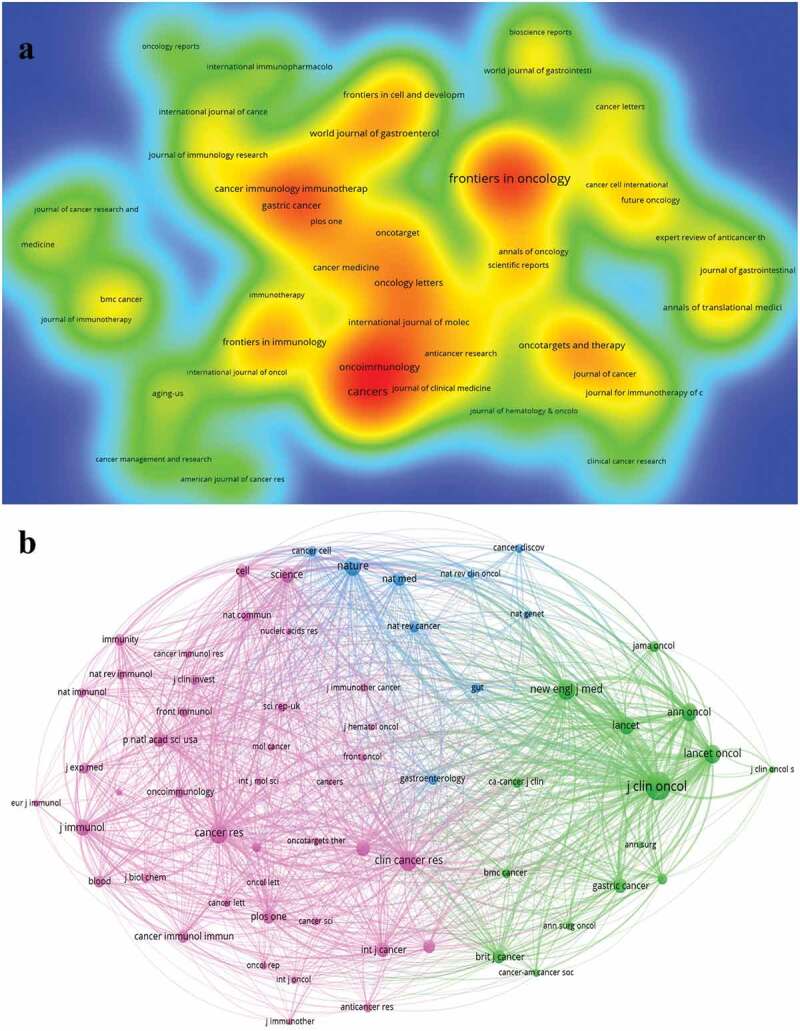
Figure 5.

A visualization of journals related to immunotherapy for GC.
a: Number of citations by journals. The size and brightness of the nodes indicate the frequency of citations. b: A network visualization of co-cited journals. The size of the circle represents the number of co-cited. GC: gastric cancer.
