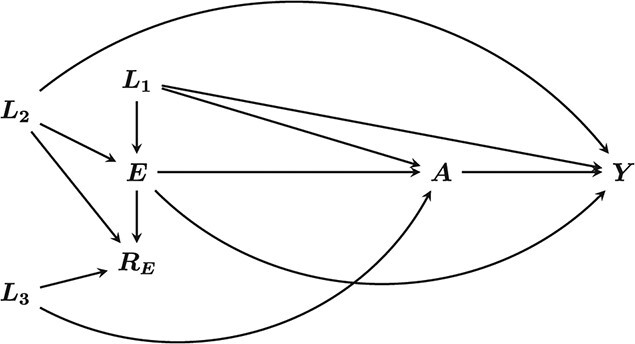
Figure 1.

Directed acyclic graph of the assumed relationships between exposure, outcome, confounders, and data missingness indicator. A and Y are the exposure and outcome respectively.  are confounders of the association between A and Y, with E the variable that determined eligibility for the target trial.
  and
and  are drivers of missing data in
  .
.
