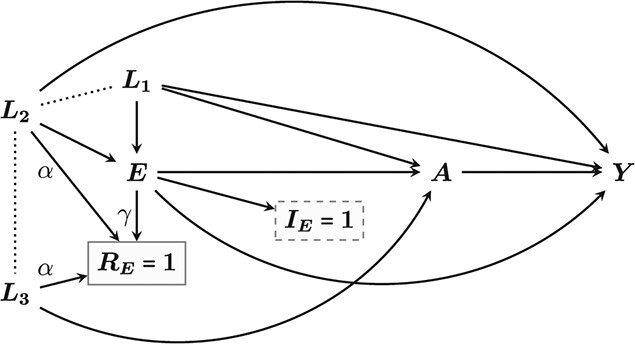
Figure 2.

Directed acyclic graph of the assumed relationships between exposure (A), outcome (Y), and confounders (L), and the eligibility processes represented by the indicator  plus the missing mechanism in
  represented by
  . The solid and dashed boxes around these main indicators represent conditioning and the dotted lines represent spurious associations caused by this conditioning.
