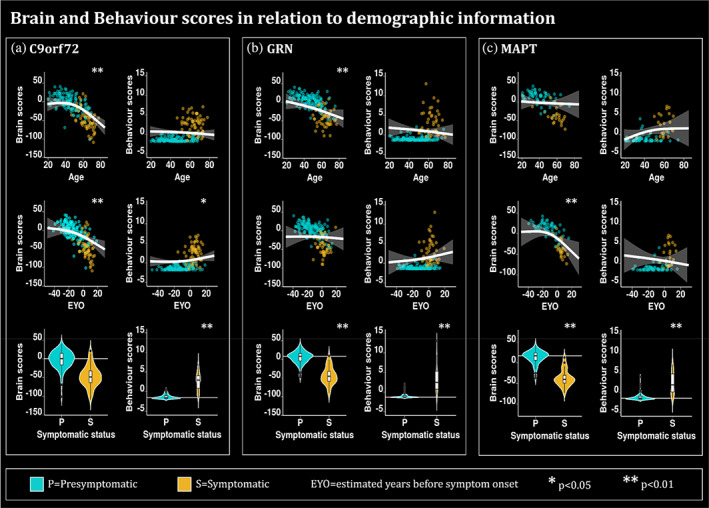
FIGURE 5.

Plots describing the relationship of the brain and behavior scores for (a) C9orf72, (b) GRN and (c) MAPT mutation carriers with demographic and clinical information such as age, EYO, and symptomatic status. The plots for age and EYO either demonstrate the second order relationships between the relative Jacobians and age using the predicted Jacobians between age 19 and 85 for a subject of mean EYO or using the predicted Jacobians between EYO‐50 and 30 for a subject of mean age, respectively. These models were computed using the unweighted averages over the levels of sex, education and symptomatic status. Turquoise is used to highlight the presymptomatic (P) individuals while gold is used to highlight the symptomatic (S) individuals. * is used to show significant variables (p < .05 after FDR correction) and ** to show significant variables (p < .01 after FDR correction. The age and EYO relationships were plotted based on the lmer model. White horizontal lines highlight the mean relative Jacobian of the presymptomatic individuals (reference group).
