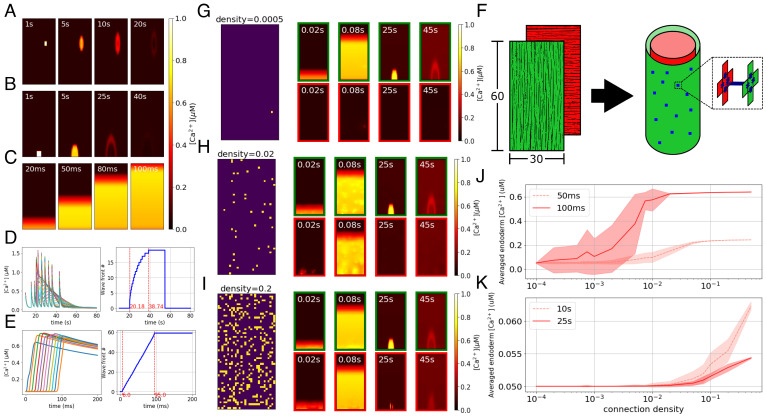
Fig. 4.
Modeled multicellular calcium dynamics. (A–C) Simulation of calcium dynamics in a muscle sheet: (A) the body column wave, (B) the bending wave, and (C) the fast wave. (D and E) [Ca2+]i traces (Left panels, each trace corresponds to a cell) and indices of wavefronts (Right panels, increasing from the Bottom to the Top) along the center longitudinal line of the muscle sheet: (D) bending wave simulated as occurring simultaneously with a late stage of contraction bursts, which is commonly observed in experiments (24); (E) fast wave. (F) Layout of the body column model. Green and red represent the ectodermal and endodermal layers respectively, in which the myonemes are aligned in longitudinal and circumferential directions respectively, as represented by the fiber directions. Blue dots represent cross-layer gap junctions. (G–I) Connectivity patterns and calcium patterns of ectoderm (green border) and endoderm (red border) in simulations with different connectivity ratios, where the ratios are separately 20% (G), 2% (H), and 0.05% (I). In connectivity patterns, each bright spot represents a gap junctional connection at that position. (J and K) Diagrams show cross-layer propagation for different connection densities of cross-layer gap junctions. We simulate 20 epochs for each density; we take snapshots at 50 ms and 100 ms after triggering only the fast pathway (J) and 10 s and 25 s after triggering only the slow pathway (K) and then average the [Ca2+]i of the whole endoderm, plotting the mean and SD of the 20 epochs for each density at these time points.

