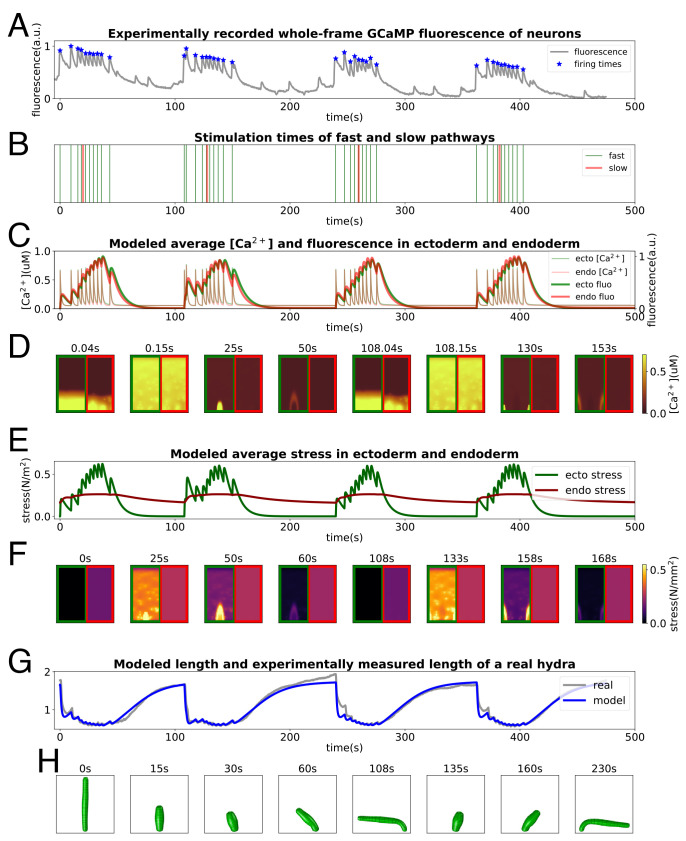
Fig. 7.
Pipeline of the simulation from neural activity to behaviors. (A and B) NGCaMP fluorescence trace: stars mark estimated times of neural firing (A) and consequently stimulation times for the model (B). (C and D) Averaged [Ca2+]i and fluorescence intensities in ectoderm and endoderm (C) and [Ca2+]i patterns of some moments (D). (E–F) Averaged active stress in ectoderm and endoderm (E) and stress patterns of some moments (F). (G and H) Comparison between length evolution of the model and from a Hydra (G) recording and some stills of the final simulated behaviors from the model (H).

