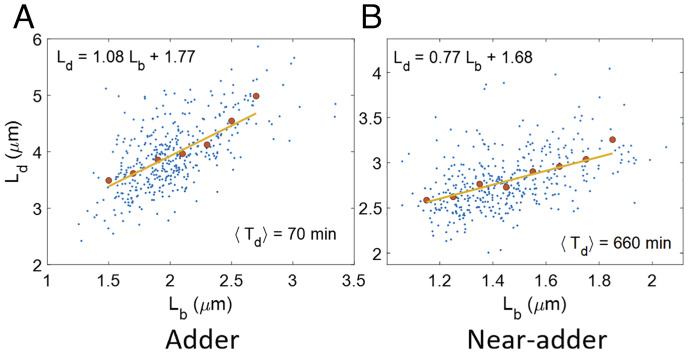
Fig. 2.
Correlation between birth and division: (A and B) Ld vs Lb graphs are plotted for data from ref. 10 in (A) Glucose-cas medium (generation time (⟨Td⟩) = 70 min, N = 409 cells). The best linear fit has a slope = 1.08 (0.97, 1.19). (B) Acetate medium (generation time (⟨Td⟩) = 660 min, N = 401 cells). The best linear fit has a slope = 0.77 (0.65, 0.89). The numbers in the parenthesis here represent the 95% confidence interval. In Fig. 2 A and B, the blue dots represent the raw data, the red dots represent the binned data, and the yellow line represents the best linear fit.

